snoop Python debugging: decorator tracing and print tools
A powerful set of Python debugging tools, based on PySnooper
At a glance
- What is it?
- snoop adds execution traces to Python functions with a decorator or context manager, while its pp helper formats targeted diagnostic output. It suits developers who need line-level visibility without setting up a full debugger.
- Who is it for?
- snoop is a practical fit for developers debugging short Python functions, decorator chains, cached calls and misleading control flow without a full debugger session. It is a poor fit for production tracing at scale, hidden code changes or projects that require a stable release channel.
- Can I use it commercially?
- Yes. MIT is a permissive licence: you can use, modify and sell software built on it, as long as you keep its copyright and licence notices.
- Is it still maintained?
- Yes. The repository last received commits 113 days ago.
- What is it written in?
- Mainly Python, according to GitHub's language statistics.
Answers come from the project's GitHub data, last synced on November 7, 2026, and from our analysis. They are not legal advice.
Star history
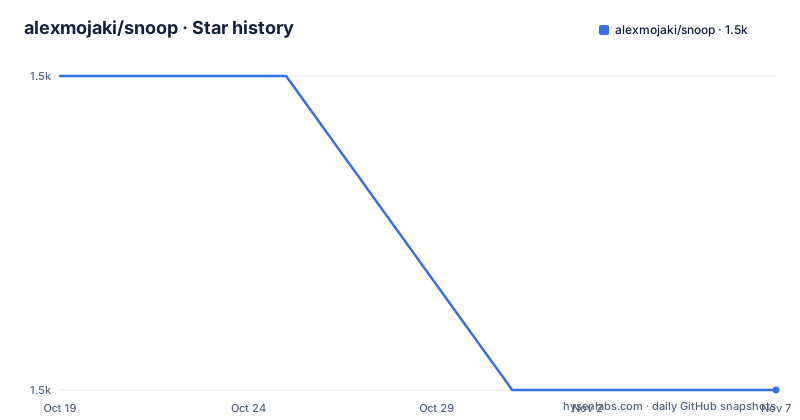
- alexmojaki/snoop1,462 ★ · -1
| Repository | 2026-10-19 | 2026-11-07 |
|---|---|---|
| alexmojaki/snoop | 1.5k | 1.5k |
-1 Stars in the last 19 days, measured from the daily GitHub snapshot. Compare with other projects
Editorial analysis
Why snoop fits line-level Python debugging
snoop addresses a specific gap between ad hoc print statements and a full debugger. A developer may suspect that a function is taking an unexpected branch, repeatedly recomputing a value or returning from a cache earlier than expected, but may not want to configure breakpoints and watches before reproducing the problem. Applying `@snoop` to a function produces a play-by-play record of executed lines, local variables and changes. The README describes this as a way to debug without carefully placing print statements throughout the code.
The library is intended primarily as a feature-oriented version of PySnooper. It also includes its own version of icecream through the `pp` helper. It is most useful during development of Python code where stderr output is acceptable and execution can be slowed by tracing. It does not replace a debugger when an engineer needs interactive control over program flow, conditional breakpoints or a persistent inspection session.
The repository README displays support for Python 2.7 and 3.5+, including PyPy. That is a concrete compatibility boundary to check against the target application, especially for modern projects. The README also advertises a FutureCoder web IDE path that applies snoop without imports or decorators, although that hosted environment is separate from installing the package locally.
Decorator tracing exposes execution order and variable changes
The basic mechanism is source-level instrumentation through a decorator. The developer imports `snoop`, places `@snoop` over a target function and calls that function normally. The resulting log goes to stderr and identifies which lines executed and when local values changed. Unlike a print statement added to one branch, this trace covers the selected function's control flow as it runs.
The decorator can cover only one call stack level by default. Setting `depth=2` follows one level of inner calls, which is useful when the interesting behavior crosses a wrapper boundary. In the README's memoization example, tracing two levels reveals the difference between a cache miss, where the wrapped `add` function executes, and a cache hit, where the wrapper returns immediately.
snoop also supports narrower scopes through a context manager. A `with snoop:` block traces only the statements inside that block, which can reduce output when a function contains unrelated work. Based on the repository layout, the tracing implementation is contained in the Python package under `snoop/`; the README does not document the low-level interception mechanism, so that implementation detail cannot be confirmed.
Watches and watch_explode broaden local-state inspection
The `watch` argument accepts arbitrary expressions as strings, allowing a trace to report selected state even when it is not represented by a simple local name. The README gives this syntax:
@snoop(watch=('foo.bar', 'self.x["whatever"]'))The expressions are evaluated as part of tracing, so their names must exist and remain readable at the points where snoop reports them. The README does not document exception handling for invalid or inaccessible watch expressions. Applications should therefore not assume that every watched expression will remain valid throughout every branch.
For containers and objects, `watch_explode` expands values into their attributes or items. The README documents this syntax:
@snoop(watch_explode=['foo', 'self'])According to the README, the trace can include entries such as `self.baz = 8` or a specific dictionary item. Advanced controls named `watch_extras`, `watch_explode` configuration and custom variable display are referenced by the README, but their complete examples are not present in the visible text. Expansion is useful for nested state, although it can increase output volume and evaluation cost. snoop does not document a built-in redaction layer, so sensitive values may appear in stderr.
pp preserves expression context during print debugging
Some failures are easier to investigate with a focused value print than with a complete execution trace. The bundled `pp` helper is designed for that case. Calling `pp(x)` prints both the source expression and its value, then returns the argument unchanged. This allows a diagnostic expression to be inserted into an existing expression without rearranging program logic.
The formatting uses `pprint.pformat` by default. If either `prettyprinter` or `pprintpp` is installed, the README says its `pformat` implementation is used instead. Multiple arguments are returned as a tuple, so `foo(*pp(x, y))` preserves the shape needed by a call that expects separate arguments.
The documented first use is:
from snoop import pp
x = 1
y = 2
pp(pp(x + 1) + max(*pp(y + 2, y + 3)))
Because each `pp` call returns its original value, the example still evaluates to `7`. Unlike `@snoop`, this helper does not describe control flow. It gives a timestamped expression and a readable rendering of one value at the point where the developer placed the call. It is therefore a smaller diagnostic tool within the same package, not a replacement for line tracing.
Installing snoop and running number_to_bits
The README gives a direct package installation command:
pip install snoopThe README's first basic example is:
import snoop

@snoop
def number_to_bits(number):
    if number:
        bits = []
        while number:
            number, remainder = divmod(number, 2)
            bits.insert(0, remainder)
        return bits
    else:
        return [0]

number_to_bits(6)
The README says to observe output to stderr. For input `6`, the documented example shows the function dividing the number by two, inserting each remainder at the front of `bits`, and returning the resulting bit sequence. The exact displayed output is shown as an image, so its complete timestamped formatting is not available as text.
The import style is flexible. `@snoop` works with `import snoop`, while `snoop.snoop` and `from snoop import snoop` are also documented. The README additionally describes calling `install()` once to enable use without a project import, but the visible README does not show a complete `install()` example. It also documents disabling the tracing and output configuration sections, although their detailed settings are not included in the visible text.
Context tracing and multi-level calls limit unrelated output
Whole-function tracing can produce more information than a developer needs when only a few statements are suspect. The `with snoop:` form limits tracing to a selected region. In the README example, a function first creates a random list and computes `min`, `max` and the midpoint inside the traced block, while the surrounding function remains outside the trace.
import snoop
import random

def foo():
    lst = []
    for i in range(10):
        lst.append(random.randrange(1, 1000))

    with snoop:
        lower = min(lst)
        upper = max(lst)
        mid = (lower + upper) / 2

    return lower, mid, upper
The README shows this pattern for tracing a selected calculation rather than the entire function. It can reduce unrelated output, but it does not eliminate the cost of tracing the statements inside the block.
For nested calls, `depth` controls how far tracing follows the call stack. The default is `1`, which does not enter inner calls. Higher values add wrapper and called-function details, but they also increase trace size. The README does not quantify overhead or document a sampling mechanism. snoop is consequently better treated as a short-lived diagnostic instrument than as an always-on logging subsystem, especially around recursive functions or high-volume loops.
Packaging, licensing and maintenance boundaries
snoop is distributed as a Python package and is licensed under MIT. The repository includes `setup.py`, `setup.cfg`, `pyproject.toml`, `MANIFEST.in` and a `snoop/` package directory. The build configuration uses `setuptools` and `wheel`, with `setuptools_scm[toml]` generating `snoop/version.py`. No GitHub releases are listed, so there is no documented release artifact or published changelog in the repository.
The last push was on 2026-07-18, and the repository is not archived. That records repository activity on that date, but it does not establish a release cadence or a compatibility policy. The absence of GitHub releases matters to teams that normally require versioned releases, upgrade notes or reproducible deployment artifacts.
The MIT license permits use, modification and redistribution under its conditions, but this review does not interpret those legal terms. Users still need to account for dependencies and their own compliance obligations. The README names `prettyprinter` and `pprintpp` as optional formatting integrations, but it does not establish their version ranges or dependency status. Package metadata and dependency resolution should be inspected before standardizing the library in a controlled environment.
Editorial conclusion
snoop is a practical fit for developers debugging short Python functions, decorator chains, cached calls and misleading control flow without a full debugger session. It is a poor fit for production tracing at scale, hidden code changes or projects that require a stable release channel. Before adoption, verify compatibility with the Python and PyPy versions in the environment, inspect how sensitive values will appear in stderr, and confirm that repository activity remains acceptable for the expected maintenance period.
Frequently asked questions
How do I install snoop for Python?
The README specifies `pip install snoop`. Install it in the same Python environment that will run the program, then import `snoop` or use the documented decorator forms.
How do I trace only part of a Python function with snoop?
Place the statements of interest inside a `with snoop:` block. The README presents this as a way to trace a selected region rather than the entire function.
Does snoop support nested function tracing?
Yes. The default `depth=1` does not enter inner calls, while a larger value such as `depth=2` follows one additional level. The README uses this to show behavior across a memoization decorator and its wrapped function.
What is the difference between @snoop and pp in the snoop package?
`@snoop` records execution through a function, including lines run and local variables changed. `pp` is a targeted print helper that formats selected expressions and values, returning its arguments so existing expression behavior is preserved.
Can snoop trace expressions and nested object attributes?
The documented `watch` argument accepts expression strings such as `foo.bar` and `self.x["whatever"]`. The `watch_explode` argument expands objects or containers to show attributes and items.
Official sources
Add this badge to your README
If you maintain this project, the badge below links readers to this analysis and shows its maintenance status from the daily GitHub snapshot. Paste the markdown into your README; add ?metric=license or ?metric=stars to the image URL for a different field.

[](https://hysenlabs.com/projects/alexmojaki-snoop)Star history chart for your README
[](https://hysenlabs.com/projects/alexmojaki-snoop)Was this useful?