L0p4Map: a PyQt6 desktop that turns ARP discovery and nmap into a topology graph
Professional network monitoring & visualization tool. L0P4Map combines high-speed ARP discovery with full nmap integration and a real-time interactive network topology engine. Works on both local networks and custom IPs/websites.
At a glance
- What is it?
- L0p4Map pairs fast ARP host discovery with full nmap integration and draws the result as a hierarchical or Force Atlas graph in a PyQt6 interface. It is aimed at researchers and administrators who want one window for discovery, fingerprinting and attack surface review.
- Who is it for?
- L0p4Map fits a researcher or administrator who wants a single desktop window for discovery, device fingerprinting, SNMP status and nmap output instead of a shell pipeline, and it does not fit an organization that needs continuous unattended monitoring, a web dashboard or any deployment on hosts where the operator cannot hold root.
- Can I use it commercially?
- Yes, with conditions. GPL-3.0 is a copyleft licence: if you distribute software that includes it, you must release that software's source code under the same licence. Running it internally without distributing it does not trigger that obligation.
- Is it still maintained?
- Yes. The repository last received commits 104 days ago.
- What is it written in?
- Mainly Python, according to GitHub's language statistics.
Answers come from the project's GitHub data, last synced on November 7, 2026, and from our analysis. They are not legal advice.
Star history
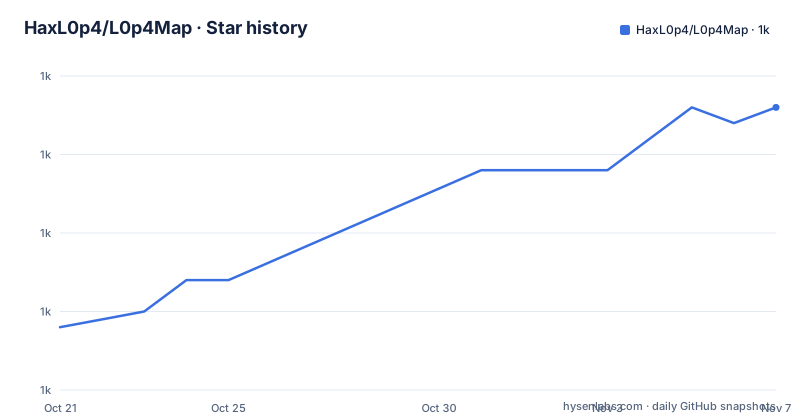
- HaxL0p4/L0p4Map1,018 ★ · +14
| Repository | 2026-10-21 | 2026-11-07 |
|---|---|---|
| HaxL0p4/L0p4Map | 1k | 1k |
14 Stars in the last 17 days, measured from the daily GitHub snapshot. Compare with other projects
Editorial analysis
Discovery first, nmap second, and one graph over the top
L0p4Map is a desktop application for network monitoring and visualization, built on PyQt6 and aimed at security researchers and network administrators. The stated idea is that nmap alone leaves you blind to structure: the tool scans, fingerprints and then draws what it found as a graph instead of a flat list.
The workflow the README describes runs in six steps. You pick a network interface from the toolbar dropdown, press SCAN to discover devices, click a device for details and quick actions such as ping, traceroute and port scan, switch to Graph to explore the topology, toggle between HIERARCHICAL and FORCE ATLAS layouts, and finally use Attack Surface to run a deep nmap plus vulners scan.
That ordering matters. Host discovery is fast because it is ARP based rather than a full sweep, and the expensive nmap work happens only when you ask for it on a device or a host. A graphical topology is the payoff, and it is the part that no shell equivalent gives you without extra tooling.
The repository layout follows the same split, with a core/ directory for the scanning and fingerprinting logic, a ui/ directory holding the PyQt6 interface and its assets, a single L0p4Map.sh launcher at the root, and a debian/ directory for packaging.
Role detection is what turns a list of addresses into a map
The feature that separates L0p4Map from a wrapper around nmap output is role detection. Each host is classified automatically as gateway, router, access point, switch, PC, Apple, mobile, Raspberry Pi, virtual machine or unknown, by combining vendor data, hostname, TTL, open ports and SNMP responses.
The fingerprinting underneath is multi-source. Hostname resolution uses reverse DNS, NetBIOS on Windows and mDNS or Avahi on Linux, Mac and IoT devices, so a hostname-only machine still gets a name. OS detection is TTL based, giving a hint of Linux or macOS, Windows, or a network device. TCP port probing is limited to topology relevant ports, and the raw SNMP sysDescr query is described as needing no external libraries.
A separate pass passively detects iLO, InfoPrint, XPort, SATO and Zebra devices by banner grabbing, and flags them on the graph as devices known to ship with default credentials. The flag is a prompt for manual verification, not an exploit attempt, and the README is explicit that it exists to be checked by a human.
ARP scanning looks up vendor data in a local IEEE OUI database, shipped as core/oui.csv in the package data. Having that table local means the interface does not need to reach an external vendor service to label a MAC address.
Routed ranges get mapped by traceroute instead of being dropped
Most scanners assume the target range is on your local segment. L0p4Map handles the wider case: you can scan any IP, CIDR or range, and for routed ranges the map is built by traceroute, with hosts grouped under the last hop router that reached them.
That mechanism explains the graph structure. The topology panel shows a live overlay with the subnet, the gateway IP, total devices and the count of intermediate devices, and each detected subnet is drawn on the graph canvas as a dashed overlay labelled with its CIDR. Edges are typed so the picture reads correctly: an uplink from the gateway to the internet, a backbone link from an intermediate device to the gateway, and a client link from a device to its parent.
The consequence for an evaluator is that L0p4Map can describe a network with several subnets and a path between them, not just a flat ARP list. The cost is that the graph only reflects what traceroute and the scan actually saw. A host that does not answer, sits behind a NAT it cannot see, or sits on a segment your interface cannot reach will simply be absent from the picture, and the tool has no way to distinguish absent from filtered.
Continuous mode watches ARP and mDNS without rescanning
The passive side of the tool is a lightweight daemon or agent that watches ARP and mDNS traffic instead of repeatedly sweeping the network. Alongside it, continuous SNMP polling keeps device status current between scans, so you do not wait for the next cycle to learn that a switch went down.
Alerting sits on top of that: the README describes real time notification when a new, unauthorized device appears on the network. Graph refresh is also configurable, with intervals of 30, 60 or 120 seconds.
The catch is that all of this depends on where the observer sits. Passive ARP and mDNS capture only sees traffic on the segment the sniffing interface is attached to, and the same root requirement that applies to the scanner applies here. On a switched network with VLANs, a sniffer on one VLAN will report devices on other VLANs as absent rather than unknown, and a DHCP lease change may be the only signal that something moved. The README does not document how to point the passive collector at a remote span port or a mirror session.
nmap runs underneath, including NSE scripts and CVE lookups
The integration is not a wrapper around a single nmap invocation. The feature list names SYN scan, UDP, OS detection, service version detection and NSE scripts, and the Attack Surface view adds exposed services, open ports, a CVE overview per host with CVSS scoring and a direct NVD link, with results exportable as CSV.
Vulnerability detection uses vulners together with vuln and malware scripts, which means the tool reaches out to a third-party service for CVE data. The security picture to hold in mind is that the scan itself is local, while the vulnerability lookup is not, and an operator running this on a client network should decide in advance what host information leaves the machine.
Other output paths exist alongside it. Full nmap output can be saved to a .txt file, the topology graph exports to CSV or PNG, and the traffic analyzer exports per device statistics to CSV. The traffic analyzer is a real time packet capture view with per device stats, protocol colouring, a filter bar and a double click action that port scans the selected host, so the traffic view and the scanner are linked rather than separate tools.
The data model is therefore three overlapping views of the same network: a device list, a graph, and a packet feed. Cross-links between them are what make the tool pleasant, and they are also what make it memory hungry on a busy segment.
Install path per platform, and the root requirement you cannot avoid
Installation is a clone and a virtual environment on Linux, macOS and Windows, with an AUR package for Arch. On Arch the README offers a one line install:
yay -S l0p4mapOn any Linux distribution the manual route is a clone, a venv and the requirements file:
git clone https://github.com/HaxL0p4/L0p4Map.git
cd L0p4Map
python3 -m venv venv
source venv/bin/activate
pip install -r requirements.txt
sudo chmod +x L0p4Map.sh
The macOS steps are the same minus the sudo on the chmod, and on Windows the activation path differs:
git clone https://github.com/HaxL0p4/L0p4Map.git
cd L0p4Map
python -m venv venv
venv\Scripts\activate
pip install -r requirements.txt
The Python dependencies are small and explicit: scapy, requests, psutil, PyQt6 and PyQt6-WebEngine. Requires-python is set to >=3.11, and the pyproject file also exposes a console entry point named l0p4map pointing at main:main.
Launching needs elevated rights on every platform, because ARP scanning and packet capture both require them:
sudo ./L0p4Map.shOn Windows the README asks for an Administrator terminal and then activates the environment and runs the entry module directly:
venv\Scripts\activate
python L0p4Map.py
Before any of this works, nmap must be installed and on PATH, along with Npcap. On Linux the README names `sudo apt install nmap` and `sudo pacman -S nmap` as the install commands, on macOS `brew install nmap`, and on Windows the official Nmap installer from nmap.org, which includes Npcap. Npcap has to be in WinPcap API-compatible mode for capture to work.
What this project is not: a server, a scheduler, or a shared database
The gap between L0p4Map and a network monitoring platform is architectural, not a missing feature. This is a desktop application. The graph lives in a window on the machine of whoever launched it, the captured packets are not written to a shared store, and there is no account system or multi-user access described anywhere in the project.
That means three common enterprise requirements are simply out of scope. There is no history to diff against, because the visible state is the current scan. There is no alerting channel, since the real time notification is an on-screen event for the person sitting at the machine. And there is no scheduling, because the application is launched by hand and closed when the operator leaves.
The licensing is GPL-3.0-or-later, and the pyproject classifiers describe the project as Beta. The last push was on 2026-07-26, and the release list shows v1.0.3 on 2026-07-17 following v1.0.2 and v1.0.1 on the same day. The version numbers and the single-day spacing of those releases say more about the state of the project than the badges do, and any plan built on long term maintenance should start from those dates rather than from the Active Development badge in the README.
Editorial conclusion
L0p4Map fits a researcher or administrator who wants a single desktop window for discovery, device fingerprinting, SNMP status and nmap output instead of a shell pipeline, and it does not fit an organization that needs continuous unattended monitoring, a web dashboard or any deployment on hosts where the operator cannot hold root. Verify three things before adopting it: that nmap and Npcap are on PATH on the target machine, that the ARP scan and packet capture work in your network with root, and that passive monitoring covers your topology. The project is licensed GPL-3.0-or-later, so a modified build you distribute carries the same obligations, and its own version numbers still sit in the 1.0.x range with the last push on 2026-07-26.
Frequently asked questions
How do I install L0p4Map on Linux?
Arch users can install from the AUR with yay -S l0p4map. On any Linux distribution the README gives a git clone, a python3 -m venv step, activation of the environment and pip install -r requirements.txt, plus nmap and Npcap as separate system requirements.
Does L0p4Map need root privileges?
Yes. The README states that root privileges are required for ARP scanning and packet capture on Linux and macOS, and that Windows must be run as Administrator. Launching on Linux and macOS is done with sudo ./L0p4Map.sh.
What is the difference between the Hierarchical and Force Atlas views in L0p4Map?
Both are layouts of the same vis.js topology graph, toggled from the graph view. The Hierarchical layout places the gateway at the top, intermediate devices such as routers, access points and switches on a second tier, and clients grouped below their parent.
Can L0p4Map scan a range that is not on my local network?
The README states that any IP, CIDR or range can be scanned, and that routed ranges are mapped via traceroute with hosts grouped under their last hop router. Router discovery therefore depends on what traceroute observes.
Does L0p4Map run continuous monitoring in the background?
It includes a lightweight daemon or agent that passively watches ARP and mDNS traffic, continuous SNMP polling for device status, and alerting when a new unauthorized device appears. The graph can auto refresh at 30, 60 or 120 second intervals.
Official sources
Add this badge to your README
If you maintain this project, the badge below links readers to this analysis and shows its maintenance status from the daily GitHub snapshot. Paste the markdown into your README; add ?metric=license or ?metric=stars to the image URL for a different field.

[](https://hysenlabs.com/projects/haxl0p4-l0p4map)Star history chart for your README
[](https://hysenlabs.com/projects/haxl0p4-l0p4map)Was this useful?