NoOne-hub/JSReverser-MCP: an MCP server for reverse engineering front-end JavaScript in a real browser
JSReverser-MCP 是一个面向 JavaScript 逆向分析的 MCP 工具,专门用于帮助开发者在真实浏览器环境中高效定位前端核心逻辑。它 将脚本检索、断点调试、函数 Hook、网络请求追踪、调用链分析、混淆还原和风险评估整合为统一能力,可直接接入 Claude、 Codex、Cursor 等支持 MCP 的客户端。你可以连接已开启的 Chrome,在登录态页面下持续采样请求参数与返回数据,快速定位签名、 加密、鉴权和关键业务流程。工具同时支持自动化页面操作与结构化报告导出,适合用于接口分析、安全研究、前端调试与工程排障等 场景
At a glance
- What is it?
- JSReverser-MCP is an Apache-2.0 licensed TypeScript MCP server that standardises a JavaScript reverse engineering workflow for coding agents, with tools for locating page scripts, hooking functions, setting breakpoints, tracing network requests and WebSocket frames, replaying evidence in Node and writing the result out as a task artifact. It connects to a real Chrome instance and can use Claude, Codex or Cursor as the client.
- Who is it for?
- Adopt JSReverser-MCP if you regularly need to understand how a web front end produces a request parameter and you want an agent to drive the browser while you keep the evidence, since the artifact model and the staged method are the substance of the project.
- Can I use it commercially?
- Yes. Apache-2.0 is a permissive licence: you can use, modify and sell software built on it, as long as you keep its copyright and licence notices.
- Is it still maintained?
- Yes. The repository last received commits 160 days ago.
- What is it written in?
- Mainly TypeScript, according to GitHub's language statistics.
Answers come from the project's GitHub data, last synced on November 7, 2026, and from our analysis. They are not legal advice.
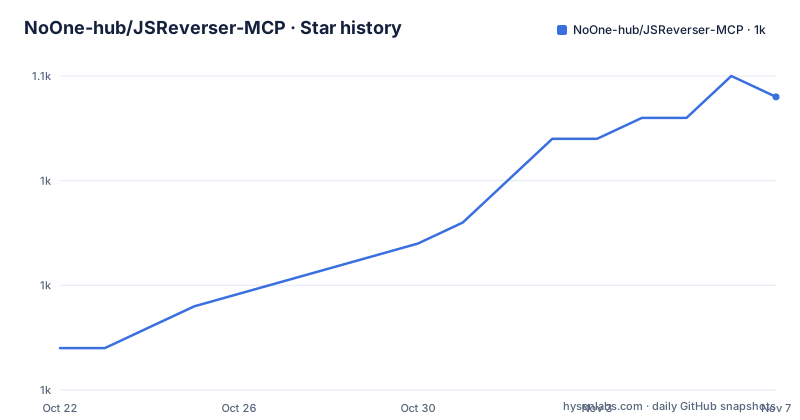
Star history
- NoOne-hub/JSReverser-MCP1,049 ★ · +12
| Repository | 2026-10-22 | 2026-11-07 |
|---|---|---|
| NoOne-hub/JSReverser-MCP | 1k | 1k |
12 Stars in the last 16 days, measured from the daily GitHub snapshot. Compare with other projects
Editorial analysis
A debugging harness exposed as MCP tools
JSReverser-MCP describes itself as an MCP service that standardises a front-end JavaScript reverse engineering process. The stated goal is not only page debugging, but to string page observation, runtime sampling, local reproduction, environment patching and evidence capture into one reusable workflow.
The mechanism is the Model Context Protocol. The tool list is exposed to an MCP client, so an agent such as Claude, Codex or Cursor can call `list_scripts`, `create_hook`, `set_breakpoint` and the rest as tools rather than as a script you paste. That is the architectural choice that distinguishes it from a collection of debugging snippets, because the tool surface is the interface and an agent can chain it.
The tool surface itself is large and organised by task. Page observation and script location come first, with `list_scripts` to establish which scripts are loaded, `get_script_source` to read one, `find_in_script` to locate a string or variable in a single script, and `search_in_scripts` to search the collected script cache in bulk. Hooking and runtime sampling follow, with `create_hook` for a reusable definition, `inject_hook` to put it into the page, `get_hook_data` to read what was captured, `hook_function` for a global or method, and `trace_function` to follow a call chain by source function name.
Then breakpoints, network analysis, WebSocket grouping, page automation, deep analysis and session state. The package is an ES module TypeScript project at version 2.0.4, Apache-2.0 licensed, with a `build/src/index.js` entry point, a `bin` entry of `jsreverser-mcp`, and tests run through the Node test runner with a `test:node20` target.
Observe first, hook preferred, breakpoint last
The project states a default methodology, and it is the part that makes this more than a tool collection. The principles are `Observe-first`, `Hook-preferred`, `Breakpoint-last`, `Rebuild-oriented`, `Evidence-first` and `Pure-extraction-after-pass`.
What they mean in practice is spelled out as a sequence. First confirm in the browser where the requests, scripts, functions and dependencies come from. Then do minimal hook sampling. Then export the local rebuild. Then patch the environment item by item in Node. And at every step, record the result as a task artifact rather than leaving it only in the conversation.
The ordering is the argument. Breakpoints are the heaviest tool and the slowest one, because a paused page costs you time and a paused debugger loses the live state you were trying to observe. Hooks give you the same information with much less disruption, and observing before you intervene tells you which function is even worth hooking.
`Rebuild-oriented` is the part with the longest reach. The goal is not to read a signature algorithm, it is to reproduce it outside the browser, in Node, where it can be run, tested and diffed. `Pure-extraction-after-pass` says the extraction comes last, after the environment has been made to match, which is the opposite of the usual approach of extracting a function from the page first and then trying to make it run.
Evidence as artifacts, and what stays out of git
The project takes the idea of evidence capture seriously enough to have a directory layout and a policy for it.
Findings are written to task artifacts, and the tooling for that is a set of task commands. `start_reverse_task` and `create_reverse_task_from_request` create a task from a target, a request or page evidence. `manage_reverse_task` is the default entry point and supports `get` and `summarize` as well as `archive`, `restore`, `search`, `tag`, `prune` and `compare`. `orchestrate_reverse_task` advances a task through the stages of observation, sampling, reconstruction, verification and purification, and returns a `recommendedStrategy`, `agentGuidance`, a `fallbackPlan` and `skipSteps`. `query_reverse_task` reads back a compact summary, next step advice, `outputMode`, `artifacts`, `patchSuggestions` and `evidenceAggregates` along with a resumable payload.
The policy on what goes into the repository is stated just as clearly. The real `artifacts/tasks/<task-id>/` directory is treated as a local private task directory by default, git only commits `artifacts/tasks/_TEMPLATE/`, and the README front page shows only desensitised parameter types and public entry points.
That is a sensible default for a tool that captures live traffic and cookies, and it is worth understanding before you run it against something you care about. The companion `skills/` directory and the `scripts/cases/` directory hold the reusable case entries, and the parameter blueprint library under `docs/knowledge/parameter-blueprints/` has replaced the older runnable case entry points, with a CLI to list, show, export and validate them:
node build/src/index.js --list-parameter-workflows
node build/src/index.js --show-parameter-workflow jd-h5st
node build/src/index.js --export-parameter-workflow-template
node build/src/index.js --validate-parameter-workflow docs/knowledge/parameter-blueprints/jd-h5st
The published cases are the request signing and risk control parameters of three Chinese platforms, with the h5st, falcon and a-bogus parameter chains indexed under `scripts/cases/README.md` and one case file per platform.
The browser is the target, and the agent is the driver
The automation layer is unusually complete, and it is the layer that makes the difference between observing a page and being able to reproduce a trigger condition.
For navigation and interaction there is `navigate_page` for going back, forward and reloading, `query_dom` to confirm selectors and node state, `click_element`, `hover_element` and `select_option` for menus and native dropdowns, `type_text` for form input, `press_key` and `upload_file` for keyboard submission and uploads, and `scroll_page` and `wait_for_network_idle` to make lazy loading and post-request evidence collection stable. There is `set_viewport` and `emulate_device` to reproduce a mobile viewport, which matters for any parameter that depends on the device, and `take_screenshot` to keep visual evidence.
For WebSocket work, `list_websocket_connections` gets you the connection identifiers, `analyze_websocket_messages` groups frames by feature so you can identify message types, and `get_websocket_messages` reads a connection or a group. The grouping step is the useful one, because a long connection stream is unreadable until it is partitioned.
For session state there is `save_session_state`, `restore_session_state`, `dump_session_state` and `load_session_state`, which save the page's cookies and storage to an in-memory snapshot, restore it, export it to JSON and load it back. Reusing a logged-in session is what makes it possible to observe the real request flow rather than a login redirect.
The configuration file shows the browser side of that. There is `BROWSER_HEADLESS`, `BROWSER_ISOLATED`, `BROWSER_EXECUTABLE_PATH`, `BROWSER_CHANNEL` and `USE_STEALTH_SCRIPTS`, and for remote debugging `REMOTE_DEBUGGING_URL` and `REMOTE_DEBUGGING_PORT`, with 9222 as the example. The `puppeteer.config.cjs` in the repository is where the browser automation is configured, and the project expects a real Chrome with remote debugging enabled rather than a headless emulation of one.
Plugging an external model into the analysis layer
The project can use an external LLM as an analysis enhancement layer, and the supported providers are `openai`, `anthropic` and `gemini`.
The configuration entry point is essentially process environment variables. The guidance is specific about where to put them: when starting the server through an MCP client, prefer passing them in the `env` block of the MCP server configuration, and the `.env` file is only suitable for running `node build/src/index.js` or `npm run start` locally.
The MCP client configuration looks like this:
[mcp_servers.js-reverse]
command = "node"
args = ["/ABSOLUTE/PATH/JSReverser-MCP/build/src/index.js"]

[mcp_servers.js-reverse.env]
DEFAULT_LLM_PROVIDER = "anthropic"
ANTHROPIC_API_KEY = "your_key"
The `.env.example` in the repository lists the full set: per provider keys, base URLs and model names, with a Gemini CLI path option, the browser settings, the remote debugging URL and port, and a `DEBUG=mcp:*` switch for the MCP layer itself.
That the analysis layer is optional is worth noting, because it separates two things that are usually conflated. The browser observation, the hooks and the artifacts are the tool. The model is an extra pair of eyes over the collected code, used by `understand_code`, which combines static analysis and AI to explain the code structure, business logic and risk, and by `deobfuscate_code` and the `risk_panel`, which aggregates code analysis, encryption detection and hook signals into a risk view.
The CLI cheatsheet at the end of the documentation shows the same surface from a terminal, including `--doctor` for a health check and the reverse task and orchestration commands, so the tool is usable without an agent at all.
Where this is the wrong tool
The first wrong case is a simple question. If you need to find one string in one script, a browser's own search and a network tab do that, and installing an MCP server, a browser bridge and a task artifact system is a lot of machinery for it.
The second is a codebase you control. This tool is for front ends you cannot read, the obfuscated, bundled and signed clients of commercial platforms. If you have the source, reading it is faster and more reliable than hooking it.
The third is authorisation. The published cases are the request signing and risk control parameters of three commercial platforms, which is exactly the class of work that needs a written agreement with the operator. A framework that makes that easy is a framework that will be used without one, so the responsibility for scoping the work to systems you are allowed to analyse sits with the operator, not with the tool.
The fourth is environments where a real browser cannot run. The design depends on attaching to a Chrome instance with remote debugging, so a locked down environment, a device without a usable browser or a headless-only pipeline will need work before anything works.
On the state of the project, the releases are v2.0.2 on 2026-03-05, v2.0.3 on 2026-03-09 and v2.0.4 on 2026-05-31, and the last push was on 2026-05-31 with the repository not archived. The licence is Apache-2.0, the code is TypeScript built with `tsc` and a Rollup bundle target, and the repository carries a `CLAUDE.md`, an ESLint flat config, a Prettier configuration, a `.codegraph/` directory and a `skills/` directory for the agent side.
Editorial conclusion
Adopt JSReverser-MCP if you regularly need to understand how a web front end produces a request parameter and you want an agent to drive the browser while you keep the evidence, since the artifact model and the staged method are the substance of the project. Do not adopt it if you only need to read source, since a debugger and a network tab do that, and do not point it at a system you are not authorised to analyse, because the published cases are the request signing and risk control parameters of commercial platforms. Verify first that your Chrome exposes the remote debugging port the tool expects, that the provider you configure for the analysis layer matches the client you use, and that the version you install is one you have read the change history for.
Frequently asked questions
What is JSReverser-MCP and who is it for?
It is an MCP server that standardises a front-end JavaScript reverse engineering workflow, exposing page observation, script search, function hooks, breakpoints, network and WebSocket analysis, local reproduction and evidence capture as tools for an MCP client such as Claude, Codex or Cursor, connected to a real Chrome instance.
What methodology does JSReverser-MCP follow?
The default principles are observe-first, hook-preferred, breakpoint-last, rebuild-oriented, evidence-first and pure-extraction-after-pass. In practice you confirm requests, scripts and functions in the browser first, take minimal hook samples, export a local rebuild, patch the environment in Node item by item, and record every step as a task artifact.
How do I configure an external LLM for JSReverser-MCP?
The supported providers are `openai`, `anthropic` and `gemini`, and the configuration is process environment variables. When starting the server through an MCP client you should pass them in the `env` block of the MCP server configuration, while a `.env` file is only for running the server directly with `node build/src/index.js` or `npm run start`.
Does JSReverser-MCP commit captured traffic and sessions to git?
No. The real `artifacts/tasks/<task-id>/` directory is treated as a local private task directory by default, git only commits `artifacts/tasks/_TEMPLATE/`, and the README front page shows only desensitised parameter types and public entry points.
How do I use JSReverser-MCP without an agent?
There is a CLI over the same build, with a cheatsheet including `node build/src/index.js --doctor` for a health check and the reverse task and orchestration commands, plus the parameter blueprint commands for listing, showing, exporting and validating workflows.
Official sources
Add this badge to your README
If you maintain this project, the badge below links readers to this analysis and shows its maintenance status from the daily GitHub snapshot. Paste the markdown into your README; add ?metric=license or ?metric=stars to the image URL for a different field.

[](https://hysenlabs.com/projects/noone-hub-jsreverser-mcp)Star history chart for your README
[](https://hysenlabs.com/projects/noone-hub-jsreverser-mcp)Was this useful?