easy_profiler's newest release is from 2019 and its default branch is develop
Lightweight profiler library for c++
At a glance
- What is it?
- easy_profiler is a C++ profiling library with a separate GUI, a reader and a converter. Its last commit landed in August 2026 while its newest tag is v2.1.0 from November 2019, and the root of the tree carries MIT and Apache license files side by side without saying which applies where.
- Who is it for?
- easy_profiler fits a C++ team that wants block timing and a timeline view without adopting a heavyweight profiler, and that can live with a release line frozen since 2019.
- Can I use it commercially?
- Yes. MIT is a permissive licence: you can use, modify and sell software built on it, as long as you keep its copyright and licence notices.
- Is it still maintained?
- Yes. The repository last received commits 17 days ago.
- What is it written in?
- Mainly C++, according to GitHub's language statistics.
Answers come from the project's GitHub data, last synced on November 15, 2026, and from our analysis. They are not legal advice.
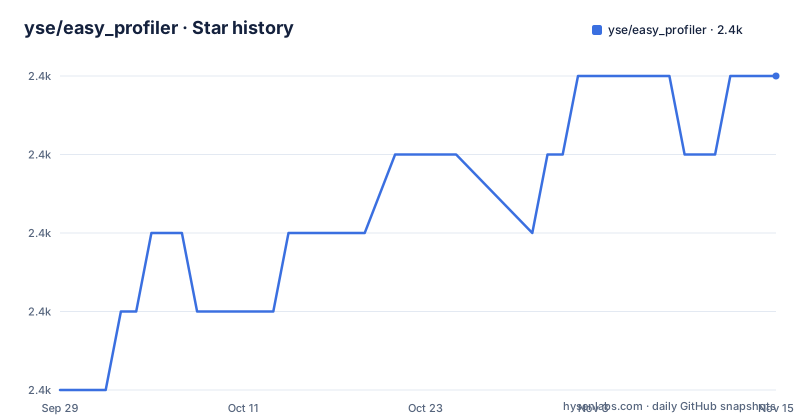
Star history
- yse/easy_profiler2,378 ★ · +4
| Repository | 2026-09-29 | 2026-11-15 |
|---|---|---|
| yse/easy_profiler | 2.4k | 2.4k |
4 Stars in the last 47 days, measured from the daily GitHub snapshot. Compare with other projects
Editorial analysis
The newest tag is from 2019 while the last commit is from August 2026
The release history and the commit history point in different directions. The three tags are v2.1.0 from 2019-11-01, v2.0.1 from 2018-06-03 and v2.0.0 from 2018-04-27, and their titles read like a changelog: v2.0.0 added arbitrary values, Snapshot and bug fixes, v2.0.1 fixed a Clang build, high-dpi displays and minor issues. The last push to the repository, on its default branch `develop`, is dated 2026-08-05. So the source has moved almost seven years past the newest published release, and the badge at the top of the page links to the v2.1.0 release rather than to anything newer. That matters most for the integration path, because the CMake instructions tell you to point `CMAKE_PREFIX_PATH` at a release package directory, which means a release package rather than the current branch. The table of contents also promises a section on the moves from 1.x to 2.x and from 2.x to 3.x, so a 3.x line is anticipated in the page structure without a 3.x tag existing.
MIT, Apache-2.0 and three license files sit at the root
The recorded license is MIT, and the badge row carries links to both the MIT license and the Apache 2.0 license. At the root there are three files: `LICENSE`, `apache.lic` and `mit.lic`. Nothing in the visible text says whether the two are alternatives you may pick from, whether both apply to different components, or whether one covers the library and the other covers something shipped beside it. That question matters more than usual here, because the repository is not one component. The top level separates `easy_profiler_core/`, `profiler_gui/`, `easy_profiler_converter/`, `reader/` and `sample/`, and the page treats the GUI as a program in its own right with its own statistics, timeline rendering, fps monitoring and snapshot saving. Pick a license by guessing which file applies to the directory you are linking, and you are guessing.
The capture port is a fixed 28077 and no step authenticates the peer
The preferred collection method is a network stream, and its five steps are spelled out. In the profiled application you invoke `profiler::startListen()`, which starts a new thread listening on port 28077 for the start capture signal. In the GUI you connect to the application using a hostname or an IP address, press `Start capture`, then press `Stop capture` and wait for the data to arrive over the network. An optional sixth action, `profiler::stopListen()`, ends the listening thread. The shown `startListen()` call takes no arguments, so the port is fixed rather than chosen by the caller, and none of the five steps carries a token, a passphrase or an address restriction. Combined with the stated design goal, that a disabled profiler does not affect execution and can sit in a Release build until enabled at run time, the practical shape is a shipping binary that opens a listener and starts recording on a signal from anything that can reach that port.
The variable example writes color where the block examples write colors
The two code samples disagree about a namespace. Block examples use the plural form, with `EASY_FUNCTION(profiler::colors::Magenta)` and `EASY_BLOCK("Addition", profiler::colors::Red)`, and the page explains that the palette is Google Material Design with custom colors accepted in ARGB, defaulting to `Amber100` when no color is given. The variable example writes the singular form instead: `EASY_ARRAY("position", &m_position.x, Size, profiler::color::Red)`. Copying that line as printed either fails to compile or silently loses the red you asked for, and the page gives no way to tell which. The same sample also shows that `EASY_ARRAY` takes a compile time element count, computed there as `constexpr auto Size = sizeof(Vector3) / sizeof(float);` and paired with `EASY_VALUE("id", m_id)` for a single value. Both macros come from a second header, `<easy/arbitrary_value.h>`, not from `<easy/profiler.h>`, which is easy to miss when only the first header is included.
The overhead numbers come from one Windows 7 machine
The performance claims are specific and quotable, and they are also tied to a single dated configuration. The page states that information for 12 million blocks uses less than 300Mb of memory, that a working profiler slows application execution by only 1 to 2 percent, and that average overhead per block is about 15ns per block, tested on an Intel Core i7-5930K at 3.5GHz running Windows 7. Nothing else in the repository backs those figures: the top level holds `.clang-format`, `.gitattributes`, `.travis.yml`, `CMakeLists.txt`, `WORKSPACE`, `appveyor.bat`, `appveyor.yml` and the component directories, with no benchmark target and no harness for measuring per block cost. The page also claims that a disabled profiler does not affect execution at all, and that the timer type is configurable through CMake or preprocessor macros, with `sample/main_clock.cpp` in the sample directory as the place that variation lives. Read the 15ns figure as one machine's number, not as a property of the library.
Three build systems and three CI configurations, none documented together
The build story is split across systems that the page never introduces at the same time. Root `CMakeLists.txt` and `sample/CMakeLists.txt` cover the CMake route, `WORKSPACE` at the root plus `sample/BUILD` point at Bazel, and `.travis.yml` points at Travis, while `appveyor.yml` and `appveyor.bat` cover AppVeyor and `.github/` covers whatever runs there. The badge in the page header tracks the AppVeyor project on the `develop` branch, which is also the repository's default branch. The two documented integration routes differ in how much you must supply. The general route asks you to point at an include directory containing `include/profiler`, define the macro `BUILD_WITH_EASY_PROFILER`, and give a library path. The CMake route asks for less and pins less:
project(my_application)

set(SOURCES
    main.cpp
)

# CMAKE_PREFIX_PATH should be set to <easy_profiler-release_dir>/lib/cmake/easy_profiler
find_package(easy_profiler REQUIRED)  # STEP 1 #########################

add_executable(my_application ${SOURCES})

target_link_libraries(my_application easy_profiler)  # STEP 2 ##########
The call carries no version argument, so nothing in your build stops it from finding a different easy_profiler than the release you intended.
Context switch capture needs Administrator on Windows or root systemtap on Linux
Beyond block timing, the library can record thread context switch events, carrying duration, the target thread id, the thread owner process id and the thread owner process name. The cost of that feature is elevated rights, and the two platforms ask for them differently. On Windows you launch the application as Administrator. On Linux you run a systemtap script with root privileges, pointing it at a script shipped in the repository:
#stap -o /tmp/cs_profiling_info.log scripts/context_switch_logger.stp name APPLICATION_NAMEwhere APPLICATION_NAME is the name of the profiled application. The page points at a wiki page for known bugs and issues on Linux based systems, which is where the reliability caveats live rather than in the main text. The same file collection also explains the rest of the tree: `profiler_gui/` is the application that renders statistics and the timeline, `reader/` and `easy_profiler_converter/` sit alongside it, and `scripts/` holds that systemtap script. The page's own table of contents continues past this point into per platform build notes for Linux, MacOS, Windows, QNX and Android, and a section on profiling application startup, none of which the visible text reaches.
Editorial conclusion
easy_profiler fits a C++ team that wants block timing and a timeline view without adopting a heavyweight profiler, and that can live with a release line frozen since 2019. Before adopting it, decide whether you build from the develop branch or from the v2.1.0 release package, check which license file governs the component you are linking, and read what your platform needs for context switch capture, since that path asks for Administrator rights on Windows or root systemtap on Linux. It is a profiler, not a sampling framework, and its published overhead numbers come from one Windows 7 machine.
Frequently asked questions
What is easy_profiler used for?
It measures the time of any block of C++ code and reports the results in a separate GUI that renders a timeline and full statistics. It also captures thread context switch events, stores user variables as single values or arrays, and can connect to an application that is already profiling so that startup cost is visible.
How do I collect profiling data from an easy_profiler application?
There are two routes. Either call `profiler::startListen()` in the application and connect the GUI over port 28077, or enable capturing with the `EASY_PROFILER_ENABLE` macro and call `profiler::dumpBlocksToFile("test_profile.prof")` wherever you want the data written.
Which easy_profiler version is current?
The newest release is v2.1.0, tagged on 2019-11-01, while the repository's default branch is `develop` and its last commit is dated 2026-08-05. The page links to the v2.1.0 release from its badge row.
What license does easy_profiler use?
The recorded license is MIT, and the badge row links to both MIT and Apache 2.0. Three files sit at the root: LICENSE, apache.lic and mit.lic, and the visible text does not say which of them governs which component.
Does easy_profiler slow down a release build?
The page states that a disabled profiler does not affect application execution in any way, and that you can leave it in a Release build and enable it at run time. With the profiler running it reports a 1 to 2 percent slowdown and about 15ns of overhead per block, measured on an Intel Core i7-5930K at 3.5GHz under Windows 7.
Official sources
Add this badge to your README
If you maintain this project, the badge below links readers to this analysis and shows its maintenance status from the daily GitHub snapshot. Paste the markdown into your README; add ?metric=license or ?metric=stars to the image URL for a different field.

[](https://hysenlabs.com/projects/yse-easy-profiler)Star history chart for your README
[](https://hysenlabs.com/projects/yse-easy-profiler)Was this useful?