Algorithm Visualizer: Turning Source Code into Step-by-Step Animations
GitHub describes it as :fireworks:Interactive Online Platform that Visualizes Algorithms from Code. The repository metadata lists JavaScript as its primary language. The metadata lists the MIT license. This article stays within the project description and details documented in the GitHub repository README.
At a glance
- What is it?
- Algorithm Visualizer is an open source React web app that turns code into interactive algorithm animations. The core idea is a command stream: tracers extract visualization commands from code, and the app interprets them into visuals.
- Who is it for?
- Adopt Algorithm Visualizer if you teach or study algorithms and want a browser-based tool that animates code without writing custom graphics code. Do not adopt it if you need a production-grade visualization library with active maintenance, or if you expect the web app alone to render visualizations without the separate tracers and server components.
- Can I use it commercially?
- Yes. MIT is a permissive licence: you can use, modify and sell software built on it, as long as you keep its copyright and licence notices.
- Is it still maintained?
- Probably not. The repository last received commits 29 months ago, on June 9, 2024.
- What is it written in?
- Mainly JavaScript, according to GitHub's language statistics.
Answers come from the project's GitHub data, last synced on November 15, 2026, and from our analysis. They are not legal advice.
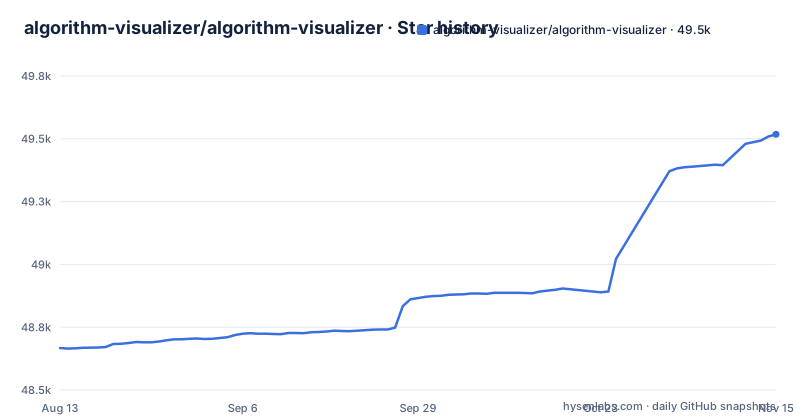
Star history
- algorithm-visualizer/algorithm-visualizer49,518 ★ · +851
| Repository | 2026-08-13 | 2026-11-15 |
|---|---|---|
| algorithm-visualizer/algorithm-visualizer | 48.7k | 49.5k |
851 Stars in the last 94 days, measured from the daily GitHub snapshot. Compare with other projects
Editorial analysis
What Problem This Project Actually Solves
Algorithm Visualizer addresses a specific teaching gap: showing how an algorithm behaves as it runs, not just what its final output is. For a student, reading a sorting algorithm in pseudocode is one thing; watching the array elements swap positions step by step is another. For a teacher, preparing a lecture on graph traversal or dynamic programming often means building custom animations from scratch, which is time-consuming. This platform aims to remove that burden by generating visualizations directly from code. The target audience is students, teachers, and professionals who want an interactive way to explore algorithms. The README states that the platform provides 'an engaging way to explore and understand various algorithms,' and the key feature is to 'visualize algorithms from code.' The scope is educational, not industrial. It is a tool for comprehension, not for profiling or debugging production code.
The Command Stream Architecture Behind the Visuals
The repository is the web app, but it is only one piece of a larger system. The README explains that the project consists of multiple repositories. The web app, written in React, contains UI components and interprets commands into visualizations. Those commands come from a separate set of libraries called tracers. Each tracer is written in a supported language, and its job is to 'extract visualization commands from code.' So the data flow is: user writes code in a supported language, the tracer extracts a sequence of visualization commands from that code, and the React app receives those commands and renders them as animations. This separation is a deliberate architectural choice. It means the visualization logic is decoupled from the algorithm logic. The algorithms themselves live in a separate repository, which the README links to, and those contributions directly affect the educational content on the site.
Getting It Running: Repositories, Dependencies, and Setup
The README does not provide explicit installation commands for the web app. That is a notable gap. What it does provide is a list of repositories that make up the ecosystem. The main repository is the React web app. There is a server repository that 'serves the web app and provides APIs that it needs on the fly,' including GitHub sign-in and compiling or running code. There is an algorithms repository with the visualizations shown in the side menu. And there are tracer libraries for each supported language. To run the full platform locally, you would need to clone the web app, the server, and at least one tracer library. The README points to CONTRIBUTING.md for guidelines, but the content of that file is not included in the README. So a new user must infer the setup steps from the repository structure. The primary language is JavaScript, which suggests a Node.js environment, but the exact commands are not documented in the README. This is a real friction point for adoption.
Where the Documentation Falls Short and What That Means
The README is short on operational details. It does not mention how to install dependencies, how to start a development server, how to build for production, or how to configure the server connection. It also does not list the supported programming languages for tracers. The description says 'various programming languages,' but no names are given. For an engineer evaluating this project, that is a serious limitation. You cannot plan an integration without knowing the language bindings or the API contract for the command stream. The README also does not specify how the tracers communicate with the web app. Is it over HTTP, WebSocket, or a file? That information is absent. The lack of recent releases is another concern. The repository publishes no releases. That means you cannot rely on a stable release tag. You would have to build from the master branch, which carries its own risk. The project is not archived, but its last push was in June 2024, so maintenance appears slow.
The Live Demo as the Only Confirmed Path
The README points to a live demo at algorithm-visualizer.org. That is the only confirmed way to see the platform in action. The README says, 'Learning an algorithm gets much easier with visualizing it. Don't get what we mean? Check it out.' That is a direct invitation to use the hosted version. For a teacher who wants to show animations in a classroom without setting up infrastructure, the live demo might be sufficient. The side menu of the website shows the available algorithm visualizations, which are contributed through the algorithms repository. So the content is not fixed; it grows as people contribute. But the demo depends on the server repository to compile and run code. If the server is down or overloaded, the demo will not work. The README does not mention any offline mode or a packaged version. So the hosted demo is the primary entry point, and the self-hosted path is undocumented in the README.
A Genuine Limitation: It Visualizes Code, Not Just Algorithms
The core promise is to visualize algorithms from code, but that comes with a constraint. The tracer libraries must be written for a specific language and must understand the constructs of that language well enough to emit visualization commands. That means the visualization quality depends on the tracer's ability to map language-level operations to visual events. The README does not specify which languages are supported, so you cannot know if your language of choice is covered. Another limitation is that the visualization is only as good as the algorithm's structure. If an algorithm does not operate on a visible data structure, like a recursive function that computes a number, the visualization might be less informative. The platform is designed for data-structure-heavy algorithms like sorting, searching, and graph traversal. For abstract numerical algorithms, it may be the wrong tool.
Alternative Approaches: Custom Animation vs. Library-Based Visualization
A real alternative is to build custom animations using a general-purpose graphics library like D3.js or a canvas-based framework. The difference in approach is fundamental. Algorithm Visualizer uses a command stream: the tracer extracts commands from code, and the web app interprets them. That means the visualization is tightly coupled to the code execution. With D3.js, you would write the animation logic yourself, binding data to DOM elements and updating them on a timer. You have full control over the visuals, but you also have to write the code that maps algorithm steps to visual changes. Algorithm Visualizer abstracts that mapping away, but it does so at the cost of flexibility. You are limited to the command types that the tracers emit. If you want a custom visual representation, like a 3D scatter plot for a clustering algorithm, you would need to extend the tracer or the web app. D3.js gives you that freedom from the start, but it requires more upfront work.
Maintenance, Licensing, and the Cost of Upgrades
The repository is licensed under the MIT license, which is permissive and allows commercial use, modification, and distribution, provided the license text is included. That is a low legal barrier for adoption. However, the maintenance cost is a separate concern. The README does not mention a changelog or a release process. The absence of recent releases suggests that updates are not regular. If you fork this project, you will be responsible for keeping up with changes to the React ecosystem and any dependencies. The server repository, which handles code compilation and execution, is a critical piece. Running a code execution service has security implications, especially if users can submit arbitrary code. The README does not discuss sandboxing or security measures. That is a hidden cost. For a self-hosted deployment, you would need to secure the server against malicious code execution. The tracer libraries are separate repositories, so upgrading the web app might require coordinating updates across multiple repositories. The README does not specify version compatibility between the web app and the tracers. That is a practical upgrade cost that you should verify before committing to this stack.
Editorial conclusion
Adopt Algorithm Visualizer if you teach or study algorithms and want a browser-based tool that animates code without writing custom graphics code. Do not adopt it if you need a production-grade visualization library with active maintenance, or if you expect the web app alone to render visualizations without the separate tracers and server components. Before integrating it, verify the current state of the server and tracers repositories, since the main repository has no recent releases and the README does not document a standalone build path. Check the CONTRIBUTING.md file for the exact contribution workflow, and confirm that the MIT license terms match your distribution plans.
Frequently asked questions
What is an algorithm visualizer?
On this project it is a browser platform that visualizes algorithms from code: the React app interprets commands into visualizations, tracer libraries in each supported language extract those commands from the code you write, and a separate server compiles and runs it. The site also carries tutorials, articles and videos alongside the running visualisations.
How do I use Algorithm Visualizer?
The live demo is the site itself at algorithm-visualizer.org, where you pick an algorithm from the side menu and watch it run. To add to it rather than just use it, the page splits the work across repositories: the React web app, the server that provides APIs such as sign in and code execution, the algorithms repository for the side menu content, and the tracer libraries for each language.
Is there an Algorithm Visualizer extension for VS Code?
The page does not mention a VS Code extension or any editor integration. What it describes is a browser platform with a React app, a separate server that compiles and runs code, and tracer libraries written in each supported language, with the editor inside the web app provided by the react-ace dependency.
Official sources
Add this badge to your README
If you maintain this project, the badge below links readers to this analysis and shows its maintenance status from the daily GitHub snapshot. Paste the markdown into your README; add ?metric=license or ?metric=stars to the image URL for a different field.

[](https://hysenlabs.com/projects/algorithm-visualizer-algorithm-visualizer)Star history chart for your README
[](https://hysenlabs.com/projects/algorithm-visualizer-algorithm-visualizer)Was this useful?