vite-plugin-inspect shows the code your Vite plugins actually hand on
Inspect the intermediate state of Vite plugins
At a glance
- What is it?
- vite-plugin-inspect opens a browser panel over the transform pipeline so you can see the code before and after each plugin runs. Version 12 requires Vite 8 and the @vitejs/devtools package, and it can also capture a build instead of a dev session.
- Who is it for?
- Reach for vite-plugin-inspect when a transform is producing output you did not expect and you need to know which plugin in a long chain changed it, because it shows the input and output of each step rather than only the final bundle. It is not the tool for diagnosing your own application code, for measuring build performance, or for inspecting anything on a server that does not run Vite, and version 12 will refuse to be a realistic option on a Vite 7 project.
- Can I use it commercially?
- Yes. MIT is a permissive licence: you can use, modify and sell software built on it, as long as you keep its copyright and licence notices.
- Is it still maintained?
- Yes. The repository last received commits 30 days ago.
- What is it written in?
- Mainly TypeScript, according to GitHub's language statistics.
Answers come from the project's GitHub data, last synced on November 7, 2026, and from our analysis. They are not legal advice.
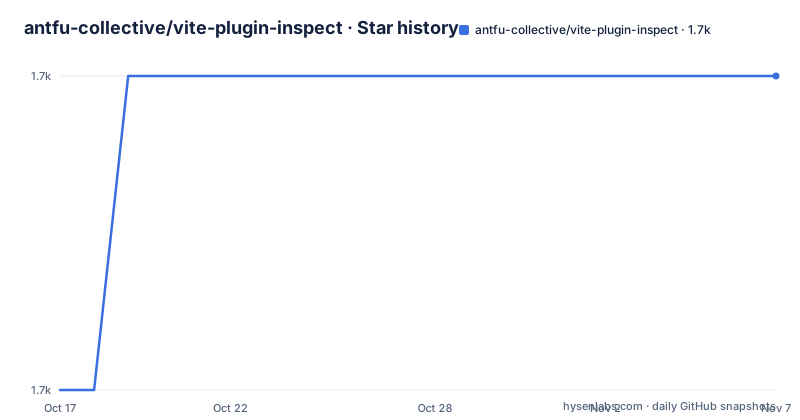
Star history
- antfu-collective/vite-plugin-inspect1,699 ★ · +1
| Repository | 2026-10-17 | 2026-11-07 |
|---|---|---|
| antfu-collective/vite-plugin-inspect | 1.7k | 1.7k |
1 Stars in the last 21 days, measured from the daily GitHub snapshot. Compare with other projects
Editorial analysis
A stack of plugins means the bug is somewhere in the chain
Vite itself is not the interesting part of a Vite project. The interesting part is the pile of plugins stacked on top of it, each one rewriting your source on the way to the browser. Add a framework plugin, a component auto-import plugin, a Markdown or i18n plugin, a code style plugin, and a handful of build-oriented transforms, and a line of code can pass through a dozen transformations before you see it.
When the output is wrong, that chain is the problem. You can read the source, and it can be correct, and the browser still gets something else. The description says it directly: inspect the intermediate state of Vite plugins, useful for debugging and authoring plugins. Two audiences, then. One is a user debugging a project they did not configure. The other is someone writing a plugin and trying to work out what shape of code arrives at their transform and what they should return.
The project is MIT licensed and sits in the antfu-collective organisation. The last push was on 2026-10-09, the same day as the v12.1.0 release, so the repository is moving.
v12 ties the inspector to Vite 8 and @vitejs/devtools
The install note is the first thing to read and it constrains everything else. Version 12.x requires Vite v8.0.0 or above and @vitejs/devtools v0.7.0 or above. For older setups, the README points at a v11 branch instead of an older release line.
That pairing is the substantive design change rather than a version bump. The package declares `@vitejs/devtools-kit` as a runtime dependency and a peer dependency on `vite` of `^8.0.0-0`. The plugin is no longer a standalone overlay that paints its own panel; it plugs into Vite's own devtools host and the config snippet that enables it turns on a `devtools` key in the same file. The result is that the inspector inherits whatever the devtools client already does for navigating modules, and that a Vite 7 project cannot use it at all.
Note that the engine field in package.json is `node >=14` while the peer dependency demands Vite 8. The node floor is not what limits you; the Vite floor is.
If you are on Vite 7 and want this today, the v11 branch is the documented path, not a downgrade of the current release.
The dev setup is two packages and four lines
Installation is one command, and the package list is part of the instruction rather than an optional extra, because the devtools package is what the panel lives in:
pnpm add -D vite-plugin-inspect @vitejs/devtoolsThen the plugin goes in the config alongside a `devtools` flag:
// vite.config.ts
import Inspect from 'vite-plugin-inspect'

export default {
  devtools: true,
  plugins: [
    Inspect()
  ],
}
The README then says to run `npm run dev` and open the DevTools to inspect the modules. That is the whole loop: a dev server session, a browser, and the panel. There is no separate CLI and no separate port to remember, which is the main ergonomic argument for putting the inspector inside Vite's devtools rather than in a standalone page.
One detail in the config is worth copying rather than skipping. The export default is a plain object, not a `defineConfig` call, and the `devtools` key sits at the top level next to `plugins`. If your config uses `defineConfig`, the option still belongs in the same place inside the object.
Build mode writes a static report you serve yourself
The default only covers the dev server, which is the right default: transforms in a live dev session are what you iterate against. When the bug only appears in a production build, there is a second mode, and it needs two changes rather than one.
The `withApp` option is what makes it possible, and the README sets it explicitly:
// vite.config.ts
import Inspect from 'vite-plugin-inspect'

export default {
  devtools: {
    build: {
      withApp: true,
    }
  },
  plugins: [
    Inspect({
      build: true
    })
  ],
}
Both keys matter. `withApp: true` under `devtools.build` is the piece that lets the devtools client exist in a build context, and `build: true` passed to the plugin is what turns on capture. Turn on only one and you have either a capture with nothing to view it in, or a client with nothing captured.
After `vite build`, the output lands in a directory named `.vite-inspect`, and the README says to check the result with `npx serve .vite-inspect`. It is a generated static site, which is convenient, and it is also a build artifact that now contains your pre-transform source in an inspectable form. It is not documented anywhere as excluded from deployment or from version control, so treat that directory the same way you would treat `dist` or a sourcemap: do not publish it by accident.
What the repository says about how the plugin is built
The package metadata describes the shape of the codebase better than the README does. It is an ES module package with `"type": "module"`, exports the main entry from `./dist/index.mjs`, a Nuxt-specific build from `./dist/nuxt.mjs`, and a wildcard `./*` passthrough. Published files are limited to `dist`, so nothing but the build output reaches npm.
That `./nuxt` export has an optional peer dependency declared in `peerDependenciesMeta` on `@nuxt/kit`, which is how the package stays usable outside Nuxt while still shipping the Nuxt entry.
There is a `src/client` directory built by a separate Vite build step (`build:client`), while the JavaScript side is bundled with `tsdown`. Type checking runs through `vue-tsc`.
For contributors, the scripts are explicit: `pnpm dev` builds the client and runs it under `INSPECT_DEV=true`, and `play` boots the `playground/` directory with `pnpm -C playground run dev`. The `test:e2e` script runs `playwright test`, with `playwright.config.ts` at the root.
Where this is the wrong tool
The scope is narrow and worth stating before you add a dependency. This is a viewer for plugin transforms, not a general devtools replacement. It does not tell you why your application code has a bug, it does not profile build time, and it does not explain why a chunk is large. If your problem is any of those, Vite's own build analysis or a profiler answers it directly.
It also only works where Vite is running. Nothing here helps with a framework that consumes Vite as a library internally without exposing a dev server you control, and there is no documentation about a remote or shared dev server, where an inspection panel that reads source from a colleague's machine would be a concern worth raising before you enable it.
The dependency chain is the other cost. You are adding a plugin plus a devtools package with its own kit, and in version 12 you are committing to Vite 8. On a large team, that upgrade is the real decision. The inspector is a good reason to move, and a poor reason to move alone.
Finally, build mode only helps if you know which build to capture. It records what the plugins did during that run, so a bug that depends on a specific set of inputs, a particular environment variable, or a flag that differs in CI will reproduce only if the build that is captured is configured the way the failing one was.
Editorial conclusion
Reach for vite-plugin-inspect when a transform is producing output you did not expect and you need to know which plugin in a long chain changed it, because it shows the input and output of each step rather than only the final bundle. It is not the tool for diagnosing your own application code, for measuring build performance, or for inspecting anything on a server that does not run Vite, and version 12 will refuse to be a realistic option on a Vite 7 project. Check your Vite major version against the peer dependency of `^8.0.0-0` before installing, then verify the generated `.vite-inspect` output is not something you would ship or commit when you enable build mode.
Frequently asked questions
How do I install vite-plugin-inspect?
The README gives `pnpm add -D vite-plugin-inspect @vitejs/devtools`, then adding `Inspect()` to the plugins array in vite.config.ts. Version 12.x requires Vite v8.0.0 or above with @vitejs/devtools v0.7.0 or above.
Can vite-plugin-inspect be used with Vite 7?
Not on the current major line. The package declares a peer dependency on `vite` of `^8.0.0-0`, and the README directs users on earlier versions to the v11 branch.
How do I inspect plugins during a production build?
Set `devtools.build.withApp` to `true` and pass `build: true` to the plugin in vite.config.ts. After `vite build`, the inspector client is generated under `.vite-inspect`, which the README says to view with `npx serve .vite-inspect`.
Official sources
Add this badge to your README
If you maintain this project, the badge below links readers to this analysis and shows its maintenance status from the daily GitHub snapshot. Paste the markdown into your README; add ?metric=license or ?metric=stars to the image URL for a different field.

[](https://hysenlabs.com/projects/antfu-collective-vite-plugin-inspect)Star history chart for your README
[](https://hysenlabs.com/projects/antfu-collective-vite-plugin-inspect)Was this useful?