ARK's Tesla valuation workbooks: a Monte Carlo model in four tabs
An excerpt from our financial valuation model of Tesla
At a glance
- What is it?
- This repository holds ARK Investment Management's published Tesla price target models as Excel workbooks, with the current 2031 version built around a Monte Carlo simulation of 5,000 runs. It is a document rather than code, and the disclaimers around it are as much of the content as the spreadsheets are.
- Who is it for?
- The repository suits a reader who wants to see how a published price target model is actually wired: which variables drive the result, how the simulation is structured and how the assumptions are presented. It is not usable as investment advice, and ARK says so repeatedly, since the outputs reflect a long-term positive view and a perfectly efficient markets assumption that the authors themselves describe as a limitation.
- Can I use it commercially?
- Not without permission. GitHub finds no licence file in the repository, and without a licence all rights are reserved by default: you may read the code but not reuse it. Check the README, or ask the authors, before using it.
- Is it still maintained?
- Yes. The repository last received commits 19 days ago.
- What is it written in?
- GitHub does not report a main language for this repository.
Answers come from the project's GitHub data, last synced on November 7, 2026, and from our analysis. They are not legal advice.
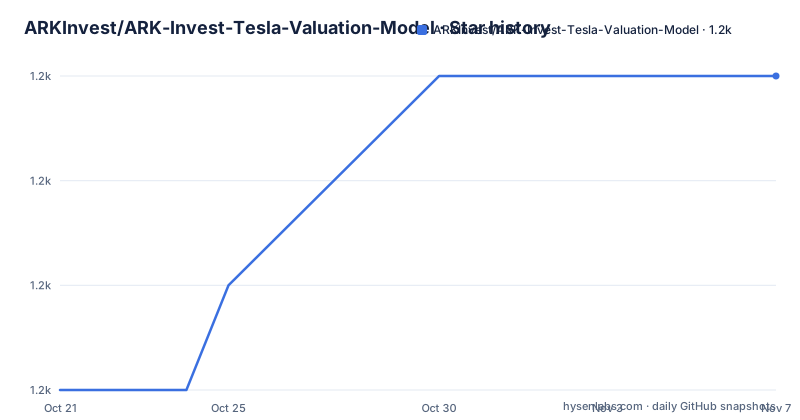
Star history
- ARKInvest/ARK-Invest-Tesla-Valuation-Model1,205 ★ · +3
| Repository | 2026-10-21 | 2026-11-07 |
|---|---|---|
| ARKInvest/ARK-Invest-Tesla-Valuation-Model | 1.2k | 1.2k |
3 Stars in the last 17 days, measured from the daily GitHub snapshot. Compare with other projects
Editorial analysis
What is actually in the repository
ARK Investment Management publishes extracts of its Tesla valuation model on GitHub, and the current README describes version 9, published on 2026-10-19, as the 2031 price target model. The name of the file it describes is Tesla 2031 Valuation Extract for Github.
The repository is a set of Excel workbooks rather than a codebase. The top level holds README.md alongside extracts for the 2024, 2025, 2026, 2029 and 2031 models, plus an older TSLA 2027 Model for Github 4.20.23.2.xlsx and a Tesla Valuation for Github_5.27.19_v3.5.xlsx from 2019. The file names carry their own version stamps, so the history of the model is visible in the directory listing rather than hidden in a release feed. There are no GitHub releases, and the repository has no license that GitHub could classify.
For a reader, that arrangement is useful in one specific way: you can see the model evolve across years. The older 2029 extract described in the previous README revision has a different worksheet design from the 2031 one, so the two are not interchangeable and the newer file is not simply a refreshed copy.
The four tabs and how the calculation flows between them
The README describes the worksheets of the current version and, more usefully, the direction of the data flow.
Tesla Valuation Inputs
Valuation ASP Tables
Monte Carlo Single Simulation
Monte Carlo Simulation Output
The Tesla Valuation Inputs tab holds all of the input variables for the Monte Carlo analysis, including a range for each variable. Those inputs feed directly into the Monte Carlo Single Simulation tab and into the price and adoption tables on the Valuation ASP Tables tab, which then feed into the simulation tab. The bull, bear and expected values are calculated on the inputs tab from the outputs of the simulation tab, so the headline numbers are derived at the end rather than typed in.
The Valuation ASP Tables tab holds the average vehicle selling price, the price per mile for a ride-hail service and the ride-hail adoption curve. The Monte Carlo Single Simulation tab takes the variables from the inputs tab and runs a single simulation using values inside the ranges set for each variable. The Monte Carlo Simulation Output tab is the output of 5,000 simulation runs, with key outputs highlighted in each column.
So the model is a spreadsheet implementation of a standard pattern: ranges in, repeated sampling, an output distribution, and a summary of the distribution fed back to the front of the workbook.
What changed between the 2029 and the 2031 workbook
The previous README revision documents version 8, published on 06/12/24, describing the Tesla 2029 Valuation Extract for Github. Its structure is different in a way that matters for anyone who has used the older file.
The 2029 workbook has a Tesla Example Valuation worksheet where users provide their own inputs for a fundamental-based valuation. The README notes that the 5 key drivers of the model can be changed in cells L12-L17, and 40 other inputs in cells L18-L64, with example bull and bear inputs supplied in columns N and O. It also makes the point that because the price target is derived from a Monte Carlo analysis, there is no single bear and bull case, even though examples are given.
That cell-level writability is a design decision. In the 2029 file the user is handed a worked example with editable drivers; in the 2031 file the user is handed the input ranges and a simulation that samples them. One lets you explore scenarios, the other lets you inspect the distribution that produces the headline target. Neither lets you change the conclusion without changing the assumptions, which is the honest limit of what a spreadsheet model can offer.
The disclaimers are part of the artifact
The README is dominated by legal and methodological text, and reading it is part of understanding the model.
The most important line is the framing of the method: a Monte Carlo simulation is intended to assist in understanding the impact of risk and uncertainty in forecasting or predicting a future event, working by assigning multiple values to a set of variables to achieve multiple results and then averaging them to obtain an estimate. Applied here, it predicts the price of a single security in future years. The README says the tool is inherently limited by its nature, including the assumption of perfectly efficient markets, and that ARK has used its research to determine reasonable ranges for the variables modelled and which business lines will have the biggest effect on the value.
The reader is urged to use extreme caution, since the forecast is inherently subjective and reflects ARK's long-term positive view of the company, and there is no guarantee that any results align with the forecast or are predictive. The tool is intended to analyse a single security, and other companies with similar or better characteristics were not considered. The forecasts are described as hypothetical and highly speculative, and the material says no representations are made as to their accuracy. ARK also states that it has no investment banking, consulting or fee-paying relationship with the subject company, and that the results will not be updated as the internal models change.
Usage rights and the age of the numbers
Two practical constraints sit outside the modelling itself.
The first is permission. The README states that the material may not be used for commercial purposes without first obtaining written permission from ARK. The repository also carries no license that GitHub could classify, so the default copyright applies and the explicit permission clause is the one that governs reuse. Editorial description of the structure is one thing; embedding the workbooks in a product or a research pipeline is another, and the line sits between them.
The second is staleness, and the README is blunt about it. The information presented reflects the views and assumptions of the authors at the time of publication, and the research is at least one year old, with the authors' current views possibly differing materially without notice. That warning applies literally here: the newest version, V9, is dated 2026-10-19, and the older extracts for 2024, 2025, 2026 and 2027 models sit alongside it with nothing in the file names to warn a reader that they are superseded.
ARK also asks for questions and constructive criticism, and points readers to the blog for a more detailed discussion of the assessment, the updates since the previous model and the key components of the model, since the workbook is explicitly an extract.
Editorial conclusion
The repository suits a reader who wants to see how a published price target model is actually wired: which variables drive the result, how the simulation is structured and how the assumptions are presented. It is not usable as investment advice, and ARK says so repeatedly, since the outputs reflect a long-term positive view and a perfectly efficient markets assumption that the authors themselves describe as a limitation. It is also not usable commercially without written permission. Verify first that you have the current version, V9 published on 2026-10-19, rather than one of the older extracts still in the repository, and read the disclaimer text in full before you run any numbers, because changing the inputs changes the conclusion rather than testing it.
Frequently asked questions
What does the ARK Tesla valuation repository contain?
It contains Excel extracts of ARK Investment Management's Tesla price target models rather than code. The current version, V9 published on 2026-10-19, is the 2031 price target model, and older extracts for the 2024, 2025, 2026, 2027 and 2029 models remain in the repository.
How many simulation runs does the model use?
The README states that the Monte Carlo Simulation Output tab is the output of 5,000 simulation runs of the Monte Carlo analysis, with key outputs highlighted in each column.
Can the ARK valuation workbook be used commercially?
The README states that the material may not be used for commercial purposes without first obtaining written permission, and the repository carries no license that GitHub could classify.
Which worksheets make up the current 2031 model?
Four: Tesla Valuation Inputs with the variable ranges and the derived bull, bear and expected values, Valuation ASP Tables with selling price, price per mile and the adoption curve, Monte Carlo Single Simulation, and Monte Carlo Simulation Output holding the results of the 5,000 runs.
Official sources
Add this badge to your README
If you maintain this project, the badge below links readers to this analysis and shows its maintenance status from the daily GitHub snapshot. Paste the markdown into your README; add ?metric=license or ?metric=stars to the image URL for a different field.

[](https://hysenlabs.com/projects/arkinvest-ark-invest-tesla-valuation-model)Star history chart for your README
[](https://hysenlabs.com/projects/arkinvest-ark-invest-tesla-valuation-model)Was this useful?