How caarlos0/starcharts builds repository star history
Plot your repository stars over time.
At a glance
- What is it?
- caarlos0/starcharts is a Go web service that turns GitHub stargazer history into a chart, with Redis caching and sampled data for large repositories. It suits maintainers who want a ready-made SVG view of star growth, but it does not provide exact daily totals when sampling is enabled.
- Who is it for?
- caarlos0/starcharts fits maintainers who want a small self-hosted SVG service for repository promotion or history tracking. It is less suitable when exact stargazer events are required, because large repositories use sampled pages.
- Can I use it commercially?
- Not without permission. GitHub finds no licence file in the repository, and without a licence all rights are reserved by default: you may read the code but not reuse it. Check the README, or ask the authors, before using it.
- Is it still maintained?
- Yes. The repository last received commits 5 days ago.
- What is it written in?
- Mainly Go, according to GitHub's language statistics.
Answers come from the project's GitHub data, last synced on November 6, 2026, and from our analysis. They are not legal advice.
Star history
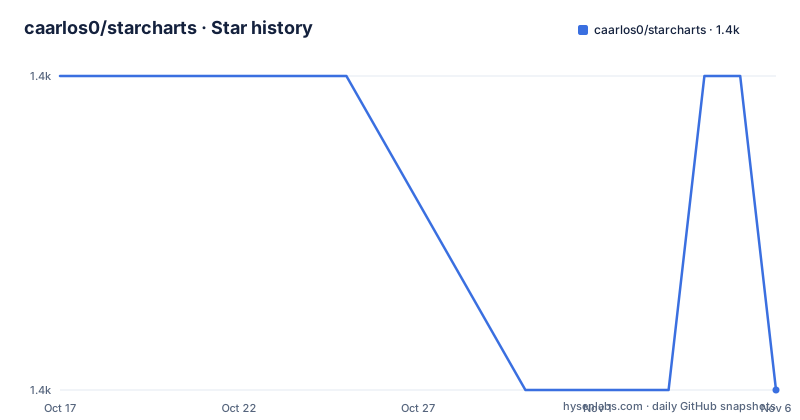
- caarlos0/starcharts1,423 ★ · -1
| Repository | 2026-10-17 | 2026-11-06 |
|---|---|---|
| caarlos0/starcharts | 1.4k | 1.4k |
-1 Stars in the last 20 days, measured from the daily GitHub snapshot. Compare with other projects
Editorial analysis
What caarlos0/starcharts solves
GitHub's repository page shows the current star total, but it does not present the accumulated sequence of stars as a time series. caarlos0/starcharts addresses that gap by turning GitHub's stargazer records into a visual history for a named repository. The result is a chart that shows how a project's audience grew rather than only reporting its final count.
The project is aimed at repository owners, open source maintainers, and engineers who want a shareable visual representation of project adoption. Its public service is documented at starchart.cc, while the repository contains a Go server, controllers, internal packages, configuration, and static assets. That layout indicates a web application rather than a command that writes a chart to a local file.
The README provides a route-shaped use case: a user opens a URL containing an owner and repository name, and the service renders the star history for that pair. This is narrower than a general analytics package. It does not document repository comparison, release analysis, or tracking other GitHub activity. Its central problem is the reconstruction and presentation of one repository's star history.
The GitHub-to-SVG request path
The documented request path begins when the browser visits a repository route. The server then retrieves star history from GitHub's API and renders the result as a chart. The README does not expose the controller functions or every internal call, so the exact function sequence cannot be confirmed. Based on the repository layout, the entry point is main.go, HTTP routing is handled under controller/, and reusable application code is organized under internal/.
The Go dependencies provide clues about the implementation without proving undocumented behavior. github.com/gorilla/mux supplies HTTP routing, github.com/go-redis/redis and github.com/go-redis/cache support Redis-backed caching, and github.com/golang/freetype plus golang.org/x/image support image or font handling. Static files live in static/, which is consistent with serving a web interface or chart-related assets from the same Go process.
The key distinction is between current popularity and historical growth. A repository can have a large final count without the application receiving every historical event. caarlos0/starcharts obtains stargazer data, derives timestamps and star counts, and sends the resulting series to a chart renderer. The hosted example uses an SVG endpoint, so SVG output is part of the documented use case even though the README does not list every response format.
Smart Sampling Mode for repositories with many stars
Fetching every GitHub stargazer page can become expensive for repositories with large audiences. caarlos0/starcharts therefore documents a Smart Sampling Mode. It first requests the first page of GitHub API data and parses the Link header to determine the total page count. The page size is configurable through GITHUB_PAGE_SIZE, with a default of 100.
When the calculated number of pages is no greater than GITHUB_MAX_SAMPLE_PAGES, the service fetches all available data. The default threshold is 15 pages, which the README describes as approximately 1,500 stars. Above that threshold, it switches automatically to sampling rather than continuing with a complete traversal.
The sampling process spreads selected pages across the complete page range. For each selected page, the service extracts the timestamp and corresponding star count from the first stargazer on that page. It then appends the current time and the total star count as the final point. The result covers the full growth timeline with fewer API requests, but it does not preserve every individual stargazer event.
This design makes trend charting more practical for popular repositories. Its trade-off is precision. A point inferred from the first stargazer on a page represents the page's time boundary, not every star granted on that date. Anyone using the chart for exact event analysis should treat sampled output as an approximation.
Running the Go service and opening its first chart
The README gives one direct development command. It requires the Go toolchain described by go.mod, and the module declares Go 1.26.0. Redis is also part of the documented configuration, while GITHUB_TOKENS is listed without a default. The README does not document an installation package or container image, so no such command is included here.
Start the application with the command exactly as documented:
go run main.goThe default LISTEN value binds the service to 127.0.0.1:3000. After the process starts, open the repository-specific route shown in the README:
http://localhost:3000/me/myrepoReplace the example owner and repository with the GitHub repository you want to inspect. The README also documents the hosted example at https://starchart.cc/caarlos0/starcharts, but that is separate from the local development command.
The service reads configuration from environment variables. REDIS_URL defaults to redis://localhost:6379. If Redis is not available at that address, the README does not state whether the server will start successfully or how it handles the failure, so that behavior should be checked during deployment planning. GITHUB_TOKENS accepts one or more comma-separated GitHub API tokens. The configuration table makes the token setting optional, but it does not explain the behavior of unauthenticated requests.
Rate limits, Redis caching, and operational boundaries
GitHub API consumption is a central operational concern because the application must retrieve stargazer history. The configuration includes GITHUB_MAX_RATE_LIMIT_USAGE, defaulting to 80, described as an API rate-limit usage threshold percentage. Smart Sampling Mode reduces the number of pages required for large repositories, but the README does not specify the exact retry policy or the behavior when the threshold is reached.
Redis is configured through REDIS_URL, whose default is redis://localhost:6379. The dependency list includes both Redis client packages and a cache package, which supports the conclusion that caching is part of the implementation. The README does not state cache keys, expiry times, invalidation rules, or what happens when the cache is unavailable. Those details matter for a self-hosted operator who needs predictable behavior.
The service also has a local-only default listener, 127.0.0.1:3000. That is a sensible default for development, but remote access would require an explicit configuration change to LISTEN. The README does not document authentication for generated chart routes, deployment behind a reverse proxy, or network restrictions for Redis. Do not infer that the default configuration is suitable for public exposure without reviewing the deployment files and runtime requirements.
Exact history versus an efficiently drawn trend
The closest practical alternative is to retrieve GitHub stargazer pages yourself and build the chart in a separate script or service. That approach can retain every returned stargazer timestamp and avoid starcharts' sampling abstraction, but it transfers pagination, rate-limit handling, caching, and rendering work to the implementer. caarlos0/starcharts takes responsibility for that pipeline and offers a ready HTTP route and SVG-oriented service instead.
The alternative is not automatically better. For a small repository that stays within the 15-page default, the README states that the service fetches all data. In that case, its chart can be closer to a complete history without requiring custom chart code. For a very large repository, the service deliberately trades individual event resolution for broader temporal coverage and fewer page fetches.
Another difference is deployment scope. A custom script can write a file, feed a dashboard, or send data to another visualization system. The documented starcharts workflow is centered on a web service and chart URLs. Projects needing those specific outputs may prefer the repository's route and SVG example; projects needing raw events, custom exports, or offline batch processing would need to verify whether the current implementation exposes them, because the README does not document them.
Maintenance signals and upgrade implications
The repository is not archived. Its last push was on 2026-10-01, and the release history includes v1.11.0 on 2026-02-21, v1.10.0 on 2025-04-14, and v1.9.1 on 2024-01-02. These dates show recent repository activity and versioned releases, but they do not establish compatibility guarantees or a detailed support policy.
Upgrading may involve more than changing an application version. go.mod requires Go 1.26.0 and several pinned dependencies, including Redis, Gorilla mux, Prometheus client libraries, and testing packages. The README does not document a migration procedure, configuration compatibility policy, or rollback procedure. An operator should therefore treat changes to environment variables, Redis behavior, GitHub API handling, and the rendering path as items to verify after an upgrade.
The repository information lists the license as unknown, and the README does not state licensing terms. No legal conclusion about copying, modification, redistribution, or deployment can be drawn from these sources. That is a concrete adoption boundary for organizations that require an approved license before using the code internally or offering it as a service.
Editorial conclusion
caarlos0/starcharts fits maintainers who want a small self-hosted SVG service for repository promotion or history tracking. It is less suitable when exact stargazer events are required, because large repositories use sampled pages. Verify first that GitHub tokens, Redis, the selected sampling threshold, and the unspecified license policy match your deployment requirements.
Frequently asked questions
How do I run caarlos0/starcharts locally?
The README documents `go run main.go`, then opening a repository route such as `http://localhost:3000/me/myrepo`. The default listen address is `127.0.0.1:3000`, and the module declares Go 1.26.0.
Does caarlos0/starcharts fetch every star for a large repository?
No. When the repository exceeds `GITHUB_MAX_SAMPLE_PAGES`, Smart Sampling Mode selects pages across the full history. It appends the current time and total star count as the final point, so the chart shows the trend rather than every individual event.
What configuration does caarlos0/starcharts use?
The README lists `REDIS_URL`, `GITHUB_TOKENS`, `GITHUB_PAGE_SIZE`, `GITHUB_MAX_SAMPLE_PAGES`, `GITHUB_MAX_RATE_LIMIT_USAGE`, and `LISTEN`. Their documented defaults are `redis://localhost:6379`, no token, `100`, `15`, `80`, and `127.0.0.1:3000`.
Official sources
Add this badge to your README
If you maintain this project, the badge below links readers to this analysis and shows its maintenance status from the daily GitHub snapshot. Paste the markdown into your README; add ?metric=license or ?metric=stars to the image URL for a different field.

[](https://hysenlabs.com/projects/caarlos0-starcharts)Star history chart for your README
[](https://hysenlabs.com/projects/caarlos0-starcharts)Was this useful?