rpi-power-monitor and the Raspberry Pi that watches your mains
Power Monitor (for Raspberry Pi)
At a glance
- What is it?
- rpi-power-monitor is a hardware and software project that turns a Raspberry Pi with a custom board into a real time power meter, reading up to six current transformers and one AC voltage channel and feeding the numbers into InfluxDB and a Grafana dashboard. The measurement chain is careful, while the software around it is an alpha release with dependencies pinned years ago.
- Who is it for?
- Adopt rpi-power-monitor if you want to understand a household or solar installation at the circuit level, you are comfortable with a Raspberry Pi, a custom PCB and a current clamp, and you are willing to own a Grafana and InfluxDB stack on the same device. Do not adopt it for a plug-and-read energy meter, and do not adopt it in production monitoring where an alpha status and dependencies pinned to exact versions would be an unacceptable risk.
- Can I use it commercially?
- Yes, with conditions. GPL-3.0 is a copyleft licence: if you distribute software that includes it, you must release that software's source code under the same licence. Running it internally without distributing it does not trigger that obligation.
- Is it still maintained?
- Yes. The repository last received commits 73 days ago.
- What is it written in?
- Mainly Python, according to GitHub's language statistics.
Answers come from the project's GitHub data, last synced on November 7, 2026, and from our analysis. They are not legal advice.
Star history
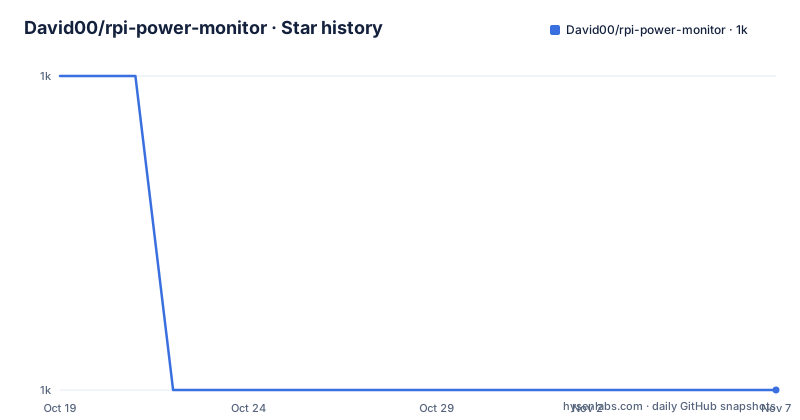
- David00/rpi-power-monitor1,035 ★ · -1
| Repository | 2026-10-19 | 2026-11-07 |
|---|---|---|
| David00/rpi-power-monitor | 1k | 1k |
-1 Stars in the last 19 days, measured from the daily GitHub snapshot. Compare with other projects
Editorial analysis
A meter you build yourself, on hardware you order
rpi-power-monitor is a combination of custom hardware and software for monitoring a power situation in real time, covering consumption, generation and net production. The data goes into a database and is displayed in a Grafana dashboard for monitoring and reporting.
The important word in that description is custom. This is not a script that reads a smart plug. The project exists because the author wanted accurate measurements of a specific installation, and the accuracy comes from the hardware: current transformers around the conductors, a voltage reference, and an analog to digital converter read over the SPI bus. The project is derived from and inspired by the resources at learn.openenergymonitor.org, and the credits name OpenEnergyMonitor and forum member Robert.Wall for guidance, plus the spidev project for providing the interface to that converter.
The audience is therefore two groups, and they need different things. One group is a maker with a specific question about their own home or solar setup, who will solder, order boards and debug. The other is a builder who would rather buy a finished board, and the author offers DIY kits, factory assembled PCBs and a variety of current transformers for that purpose through power-monitor.dalbrecht.tech.
What you get in either case is a measurement system that is yours, with raw data you can query, rather than a monthly number from a supplier.
Six current transformers and a single voltage channel
The circuitry supports monitoring of up to 6 current transformers and one AC voltage reading. The individual transformer readings then feed calculations that produce the headline metrics: total home consumption, total solar PV generation, net home consumption, net home generation, and the current, voltage, power and power factor values, plus the individual current transformer readings and harmonics inspection through a built in snapshot and plotting mechanism.
That layout has consequences. Six current transformers means six conductors you want to watch, which for a house with a solar array usually means the grid feed, the generation output, and a set of branch circuits. One voltage channel means a single voltage reference is shared, so the voltage reading describes the site rather than each circuit individually, and current, being measured per conductor against that reference, is what distinguishes the channels from each other.
The distinction between gross consumption, gross generation and the net of the two is the reason to build something like this rather than use a utility meter. A household that both consumes and generates has a number that moves in both directions, and a monitor that reports net production in real time tells you something a monthly bill cannot. It is also the number that matters when you are deciding whether a battery is worth buying.
The repository layout matches a small embedded project: a LICENSE, a README, a cases/ directory for the enclosures, a requirements.txt, an rpi_power_monitor/ package and a setup.py.
Tens of thousands of samples per second, and why phase error matters
The measurement description in the documentation is where the engineering is, and it is worth reading closely.
The code takes tens of thousands of samples per second, corrects for phase errors in the measurements, calculates the instantaneous power for the sampled points, and uses those instantaneous power calculations to determine real power, apparent power and power factor. The stated consequence is that the project can monitor any type of load, including reactive, capacitive and resistive loads.
Each of those four steps is a separate source of error that a naive implementation gets wrong. Sampling too slowly misses the shape of the waveform, and a mains frequency sine sampled at a low rate produces a number that looks plausible and is wrong. Phase error between the voltage reference and the current transformer, caused by the angle of the CT around the conductor and by the resistance of the winding, shifts the current relative to the voltage, and that shift moves real power and power factor. Computing instantaneous power first and then deriving real, apparent and power factor from it is the approach that survives that error.
The harmonics snapshot exists because the same machinery that gives you accurate power also gives you a view of waveform distortion, which is what tells you whether a load is behaving. A cheap energy monitor gives you watts. This gives you the shape of the current.
InfluxDB for storage, Grafana for the picture
The software side of the project is a set of Python packages whose dependency list tells you what it does. The requirements are pinned exactly:
influxdb==5.2.3
prettytable==0.7.2
plotly==4.5.4
spidev==3.6
requests==2.21.0
tomli==2.0.1
The stack is legible from that. influxdb is where the samples land, which is the natural home for a time series of this density. prettytable is for the terminal output, the readable summary of a reading rather than a chart. plotly handles the built in snapshot and plotting mechanism used for the harmonics inspection. spidev is the SPI interface to the analog to digital converter, and it is the one dependency that touches the hardware directly. requests is there for talking to services such as the database, and tomli is a TOML parser, which is how the configuration is read.
The setup.py describes the package itself, named rpi_power_monitor, with a license declared as the GNU General Public License version 3, and classifiers that describe it as POSIX on Linux, Python 3, and, tellingly, with a development status of 3 - Alpha. That last classifier is the one to take seriously. It is the maintainer's own assessment of the maturity of the software half of a project whose hardware half is a physical thing you solder together.
One more file is worth noting: requirements.txt lists bcrypt as well, which the install_requires list in setup.py does not. A dependency that appears in one but not the other is a small inconsistency in a project where the packaged install and the manual install are two different paths.
Two ways to install, and a documentation site frozen in time
Installation splits into two routes: flash a custom OS image to the microSD card, or perform a manual installation on an existing image. Both are documented, and the README points to the Software Installation section of the documentation for them, then to the configuration section for setting the monitor up afterwards.
The prebuilt image route is the sensible one for most people, because it removes the kernel module and dependency problems from the critical path. The manual route is for people with an existing system they do not want to replace.
Here is the part that needs care. The configuration link in the README points at documentation for v0.3.0, while the package version in setup.py is 0.3.4 and the newest tag is v0.3.3. So the versioned documentation you are sent to does not describe the version you are installing. The documentation site also carries a Last Updated marker of April 2023 at the bottom of the README, while the code has moved on since, with the last push on 2026-08-27 and the v0.3.3 tag published on 2025-03-14.
That gap between the documentation and the code is the single most likely source of confusion for a new user, and it is a documentation problem rather than a design problem. The configuration file format is read through tomli, so it is TOML, and the versioned configuration page is the place to learn the keys, but expect to reconcile it with whatever the current code expects.
Why build a meter when you can buy one
The honest alternative is a commercial plug-in energy monitor, and it wins on almost every axis except ownership of the data and granularity.
A plug-in meter is a calibrated, certified device. It costs a fixed amount, works in a minute, and reports whatever the manufacturer decided to report, usually one instantaneous power figure and a running total. The rpi-power-monitor approach is a months-long build with a custom PCB, current transformers you have to place correctly around live conductors, and software you run yourself.
What you get in exchange is a system that reports what the project lists, which is a much wider set: real, apparent and power factor, per transformer readings, harmonics, and the gross and net split between consumption and generation, all queryable in a database you own. And because the software is open, you can change what it computes. The project is derived from OpenEnergyMonitor's resources, which means the measurement approach is one with a public track record and a community behind it, not a private design.
The other realistic alternative is to keep using the utility meter and a smart plug, accepting monthly granularity and no phase or power factor detail. For a flat consumer tariff, that is enough. For anyone working out where the power goes, or tracking a solar array against consumption, it is not.
The deciding factor is almost always whether you want the data. If you only want a number, a certified device is cheaper in every way, and this project is the wrong tool.
GPL-3.0, an alpha classifier and a gap between tags and package
The licence is GPL-3.0, declared in setup.py as the GNU General Public License version 3 and stored in the LICENSE file. For a project that combines hardware designs with software, that split matters if you ever want to reuse the code in a commercial enclosure, since the copyleft obligations attach to the software distribution rather than to the circuits, though a derived circuit sold as a product is a question the licence text does not answer on its own.
The version story is the awkward part. The published tags are v0.3.3 from 2025-03-14, v0.3.2 from 2024-09-24 and v0.3.1 from 2023-08-19, at uneven intervals, and setup.py already declares version 0.3.4. In other words, the package you build from the branch is newer than any release you can download, and the tags are far apart.
Against that, the repository is not archived and the last push was on 2026-08-27, so work continues. The recent contributions are also to the documentation rather than the code, and the three releases in three years suggest a hardware project whose software is stable enough to move slowly. The alpha classifier has been in place the whole time, which usually means the maintainer means the code works but the packaging, the docs and the release discipline are not finished.
There is no CI configuration, no test directory and no contribution guide in the repository, which is consistent with a single maintainer project. The contributing invitation is an email address, [email protected], and the pending work list lives there rather than in an issue tracker.
Editorial conclusion
Adopt rpi-power-monitor if you want to understand a household or solar installation at the circuit level, you are comfortable with a Raspberry Pi, a custom PCB and a current clamp, and you are willing to own a Grafana and InfluxDB stack on the same device. Do not adopt it for a plug-and-read energy meter, and do not adopt it in production monitoring where an alpha status and dependencies pinned to exact versions would be an unacceptable risk. Verify three things first: that your transformer count fits the six channel board, that spidev is available on your kernel since it is the interface to the analog to digital converter, and that the configuration section in the versioned documentation matches the release you install. The last push was on 2026-08-27 and the newest tag is v0.3.3 from 2025-03-14, while setup.py already declares version 0.3.4, so pin a commit rather than a tag.
Frequently asked questions
What hardware does rpi-power-monitor need?
A Raspberry Pi, the custom power monitor board, and current transformers. The circuitry supports up to 6 current transformers and one AC voltage reading, and the author offers DIY kits, factory assembled PCBs and current transformers for those who would rather not fabricate.
Where does the measured data go?
The samples are stored in a database and displayed in a Grafana dashboard for monitoring and reporting. The pinned dependencies include influxdb for storage and plotly for the built in snapshot and plotting mechanism used for harmonics inspection.
How do I install the rpi-power-monitor software?
Either flash the prebuilt OS image to the microSD card or do a manual installation on an existing image, both documented in the Software Installation section of the project documentation. After installation you configure the monitor using the configuration section.
Does rpi-power-monitor work with a mains supply and solar generation?
The project reports total home consumption, total solar PV generation, and the net of both, along with current, voltage, power and power factor for each channel. It samples tens of thousands of points per second, corrects for phase errors, and handles reactive, capacitive and resistive loads.
Which Python packages does rpi-power-monitor depend on?
The pinned list is influxdb, prettytable, plotly, spidev, requests and tomli, with bcrypt also appearing in requirements.txt. spidev provides the interface to the analog to digital converter, and the package classifiers describe the project as alpha.
What licence is rpi-power-monitor released under?
GNU General Public License version 3, declared in setup.py and stored in the LICENSE file. The newest tag is v0.3.3 from 2025-03-14 while setup.py declares version 0.3.4, and the last push was on 2026-08-27.
Official sources
Add this badge to your README
If you maintain this project, the badge below links readers to this analysis and shows its maintenance status from the daily GitHub snapshot. Paste the markdown into your README; add ?metric=license or ?metric=stars to the image URL for a different field.

[](https://hysenlabs.com/projects/david00-rpi-power-monitor)Star history chart for your README
[](https://hysenlabs.com/projects/david00-rpi-power-monitor)Was this useful?