Emerge: one YAML file turns a source tree into an interactive graph
Emerge is a browser-based interactive codebase and dependency visualization tool for many different programming languages. It supports some basic code quality and graph metrics and provides a simple and intuitive way to explore and analyze a codebase by using graph structures.
At a glance
- What is it?
- Emerge, published on PyPI as emerge-viz, scans a project, computes metrics such as SLOC and fan-in/fan-out, and renders the result as an interactive HTML application built on D3 and Louvain clustering. It suits teams that want to look at an unfamiliar codebase as a graph, and it does not suit projects whose languages fall outside its parser list.
- Who is it for?
- Adopt Emerge when you need to explore an unfamiliar codebase as a graph and your languages are on the parser list, and verify first that the file scan language list covers your repository, since entity extraction is documented for a smaller set. Do not pick it for continuous code health measurement: the git-based metrics are described as experimental, the newest tagged release is 2.0.7 from 2024-07-12, and the documented Docker command still pins the 2.0.0 image.
- Can I use it commercially?
- Yes. MIT is a permissive licence: you can use, modify and sell software built on it, as long as you keep its copyright and licence notices.
- Is it still maintained?
- Yes. The repository last received commits 92 days ago.
- What is it written in?
- Mainly Python, according to GitHub's language statistics.
Answers come from the project's GitHub data, last synced on November 7, 2026, and from our analysis. They are not legal advice.
Star history
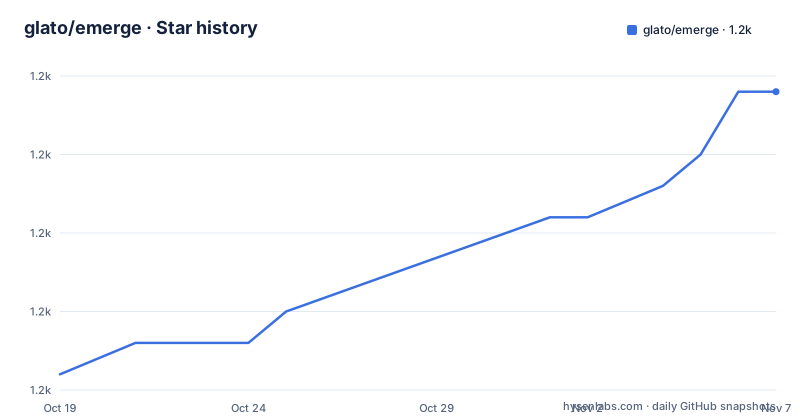
- glato/emerge1,182 ★ · +9
| Repository | 2026-10-19 | 2026-11-07 |
|---|---|---|
| glato/emerge | 1.2k | 1.2k |
9 Stars in the last 19 days, measured from the daily GitHub snapshot. Compare with other projects
Editorial analysis
From a source folder to a browsable dependency graph
Emerge is an interactive code analysis tool that gathers information about source code structure, metrics, dependencies and complexity. The workflow it describes is a scan of a project's source code, a calculation of metric results and statistics, and then a generation of an interactive web application whose views are graph structures, with exports in several file formats. The graph structures named in the feature list are a dependency graph, an inheritance graph, a complete graph that composes the two, and a filesystem graph that renders the project directory hierarchy as nodes and edges.
That filesystem view is worth noticing because it is not a metric. It exists so that a dependency edge can be read in the context of where the files sit on disk, which is a different question from how coupled two classes are.
The project states its goal as a free and open source tool for anyone interested in software development, architecture, metrics and visualization, and it frames the approach as exploratory. The word matters here. Emerge is presented as a lens for asking questions about a codebase, not as a gate that passes or fails a build.
The parser list decides which graphs you can get
Emerge is mainly written in Python 3 and is tested on macOS, Linux and current browsers, and it is published to PyPI under the name emerge-viz. Its parsing support is listed for C, C++, Groovy, Java, JavaScript, TypeScript, Kotlin, ObjC, Ruby, Swift, Python and Go.
Two different lists appear in the project's own documentation, and the difference is the practical catch. The opening description names Go among the parsed languages, while the feature list for file scan support names C, C++, Groovy, Java, JavaScript, TypeScript, Kotlin, ObjC, Ruby, Swift and Python. Basic entity scan and extraction, which is what produces the entity level graphs and the inheritance graph, is documented for a smaller set still: Groovy, Java, JavaScript, TypeScript, Kotlin and Swift. A project written in C or Python can be scanned at file level but has no documented entity extraction, so the entity and inheritance views are not available for it.
Entity scans also pull out SwiftUI and Composable declarative UI entities, and the export list names the same conditional: the entity graph output includes that extraction, the file graph does not.
Running Emerge as a container against a mounted folder
The project presents the container route as the easiest way to use Emerge, with a Docker engine as the only prerequisite. You prepare a working folder with a configuration file, an export folder and a source folder.
config.yml
📁export
📁source
The analysis is then run by mounting that folder into the container and pointing the tool at the configuration file inside it.
docker run --rm -v <YOUR_WORKING_FOLDER_PATH>:/tmp/emerge achtelik/emerge:2.0.0 /tmp/emerge/config.ymlThe final argument is the path to config.yml as seen from inside the container, which is why the folder is mounted at /tmp/emerge. The image itself is built from Ubuntu 22.04, installs graphviz and pip, and pulls the published package rather than a source checkout.
USER 1002

ENTRYPOINT ["emerge", "-c"]
That entrypoint already includes the config flag, so the config path in the run command is the argument the container passes through. The project also notes that a Pyperclip error at the end of a run can be ignored, which is a fair signal that the tool tries to copy something to the clipboard even in a headless container.
config.yml holds the analyses and the export targets
Configuration is YAML, and it can describe multiple or specific analyses. The documented example names the project, sets a log level, lists analyses with a name and a source directory, and then lists export targets with their own directory.
---
project_name: java_project_example
loglevel: info
analyses:
- analysis_name: full java check
  source_directory: /tmp/emerge/source
Two details catch newcomers. First, the paths inside the configuration must start with /tmp/emerge when you run in the container, because the analysis itself executes inside the image, not on the host. Second, the tool can also create a language or project configuration directly from an included configuration template, so a starting point does not have to be typed from scratch.
Logging is configurable by level, which matters for a tool that scans a large tree: the same run can be quiet or verbose. The package metadata gives the dependencies that make this work, and they are the giveaway that Emerge is a graph and statistics tool rather than a simple parser.
    name="emerge-viz",
    version=VERSION,
    description="Visualize source code structure and dependencies in an interactive d3 application",
The dependency list includes networkx for the graph work, scikit-learn and numpy for the statistics, python-louvain for community detection, PyDriller for the git-based metrics, and PyYAML for the configuration.
D3 layout with Louvain clustering decides what the graph looks like
The generated HTML application is built on Bootstrap, and the graph inside it is a D3 force-directed simulation. Node colours come from Louvain modularity, with some post-processing applied so that the colouring is more deterministic and stable across runs. That combination is the core idea of the tool: the physics arranges the nodes, and the community detection decides which nodes belong together visually, so a cluster of tightly coupled files reads as a coloured region rather than as a hairball.
The application also renders on HTML canvas, with translation, zooming, dragging and hover interaction, and it carries a dark mode, a live search over entities that ORs multiple search terms, an optional semantic search based on term frequency-inverse document frequency, and the option to include git metainformation such as contributor names. Selected nodes can be highlighted, single clusters can be outlined with a concave hull, and cluster metrics are displayed so that clusters can be compared with each other.
Two heatmap views add a risk reading to the picture: one highlights potentially harmful nodes based on a SLOC and fan-out score, and another visualises git-based metrics such as code churn.
The metrics are a mixed bag of settled and experimental measures
The implemented metrics are SLOC, whitespace complexity, number of methods, fan-in and fan-out, and modularity measured with Louvain. The whitespace complexity measure is credited in the project description to A. Tornhill, which is a useful detail for anyone who wants to compare numbers against other tools built on the same idea.
On top of that sit experimental git-based metrics, namely SLOC, whitespace complexity and change coupling, the last of which links files that change together in commit history. There is a separate semantic layer based on term frequency-inverse document frequency, which is used to infer meaning from feature or semantic keywords and can drive a semantic search inside the generated application.
What the git-based part does not have is a stable promise. The project labels these metrics experimental, and they depend on a full commit history, which means the results of a scan can change depending on how much history is available or how the checkout was made. The set of exports is wide: dependency graphs, inheritance graphs, the complete graph, a filesystem graph, GraphML, a JavaScript format suited for a D3 force graph simulation, the interactive HTML application, and tabular console, tabular file and JSON output.
The lighter path when an interactive app is more than you need
Emerge bundles several outputs, and the interesting decision is that you do not have to ship the whole HTML application. If a CI job only needs a machine-readable dependency graph, the GraphML export or the JavaScript format written for a D3 force graph simulation is the lighter path, since you can render it inside a dashboard you already control. The container image installs graphviz.
The same applies to metrics alone. The tabular console output, tabular file output and JSON output let a script consume the numbers without opening a browser, which is how you would feed them into a trend of your own.
Where Emerge fits badly is elsewhere. Parsing is limited to the listed languages, and entity level graphs are documented for a smaller set again, so a polyglot repository gets partial views. The git-based metrics are experimental. And the packaging has drifted: the newest tagged release is 2.0.7 from 2024-07-12, the documented Docker command still pins the 2.0.0 image, and the Docker image namespace does not match the repository owner. The repository is not archived and the last push was on 2026-08-07, so work continues on the code even though the releases have not moved since 2024.
Editorial conclusion
Adopt Emerge when you need to explore an unfamiliar codebase as a graph and your languages are on the parser list, and verify first that the file scan language list covers your repository, since entity extraction is documented for a smaller set. Do not pick it for continuous code health measurement: the git-based metrics are described as experimental, the newest tagged release is 2.0.7 from 2024-07-12, and the documented Docker command still pins the 2.0.0 image.
Frequently asked questions
What is the difference between Emerge and emerge-viz?
They are the same project under two names. The project is called Emerge, and the package published to PyPI and installed in the Docker image is emerge-viz, whose setup.py description reads "Visualize source code structure and dependencies in an interactive d3 application".
How do I run Emerge with Docker?
Prepare a working folder containing config.yml, an export folder and a source folder, then run the container with your folder mounted at /tmp/emerge and the path to config.yml inside the container as the final argument. Paths in the configuration must start with /tmp/emerge for the run to find them.
Which languages can Emerge scan and which support entity extraction?
The opening description lists parsing support for C, C++, Groovy, Java, JavaScript, TypeScript, Kotlin, ObjC, Ruby, Swift, Python and Go, while the file scan feature list names the same set without Go. Basic entity scan and extraction is documented for Groovy, Java, JavaScript, TypeScript, Kotlin and Swift only.
What metrics does Emerge compute for a project?
The implemented metrics are SLOC, whitespace complexity, number of methods, fan-in and fan-out, and modularity using Louvain. Additional git-based metrics covering SLOC, whitespace complexity and change coupling are described as experimental, and a semantic layer based on term frequency-inverse document frequency is used for keyword extraction and optional semantic search.
Can I export Emerge results without generating the interactive HTML app?
Yes. The documented exports include GraphML, a JavaScript format for a D3 force graph simulation, tabular console output, tabular file output and JSON output, so a script can consume the graph or the metrics without opening a browser.
Official sources
Add this badge to your README
If you maintain this project, the badge below links readers to this analysis and shows its maintenance status from the daily GitHub snapshot. Paste the markdown into your README; add ?metric=license or ?metric=stars to the image URL for a different field.

[](https://hysenlabs.com/projects/glato-emerge)Star history chart for your README
[](https://hysenlabs.com/projects/glato-emerge)Was this useful?