Optopsy Python Backtesting for Options Strategies
A nimble options research and backtesting library for Python
At a glance
- What is it?
- Optopsy is a Python library for researching and backtesting options strategies against tabular option-chain data. It combines 38 spread strategies with trade simulation, risk metrics, entry signals, and local market-data caching, but requires Python 3.12 or 3.13 and suitable historical data.
- Who is it for?
- Optopsy fits Python researchers who already have compatible options-chain data and want repeatable comparisons across defined-leg strategies. It is a poor fit for users needing Python 3.11 or earlier, guaranteed exchange-calendar order execution, or a turnkey dataset without supplying data credentials or a provider.
- Can I use it commercially?
- Yes, with strict conditions. AGPL-3.0 is a network copyleft licence: if people use a modified version over a network, for example as a hosted service, you must offer them its source code under the same licence.
- Is it still maintained?
- Yes. The repository last received commits 3 days ago.
- What is it written in?
- Mainly Python, according to GitHub's language statistics.
Answers come from the project's GitHub data, last synced on November 7, 2026, and from our analysis. They are not legal advice.
Star history
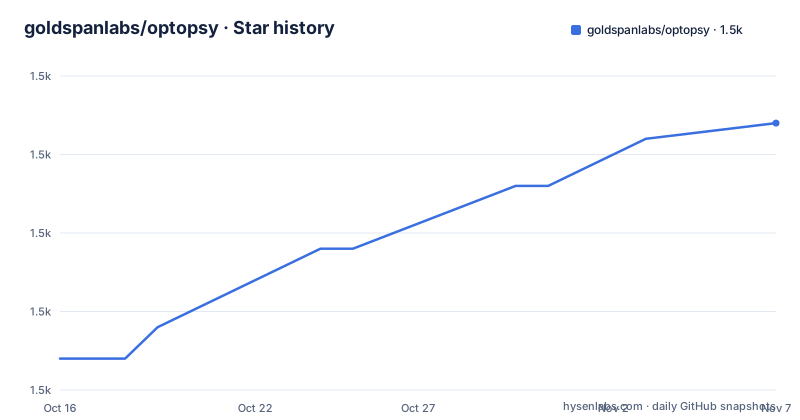
- goldspanlabs/optopsy1,512 ★ · +15
| Repository | 2026-10-16 | 2026-11-07 |
|---|---|---|
| goldspanlabs/optopsy | 1.5k | 1.5k |
15 Stars in the last 22 days, measured from the daily GitHub snapshot. Compare with other projects
Editorial analysis
Optopsy's Options Research Problem
Optopsy addresses a specific research bottleneck: evaluating many options constructions across many quote dates without manually rebuilding every expiration and strike combination in a spreadsheet. Its intended users are Python developers, quantitative researchers, and traders who need repeatable comparisons among calls, puts, verticals, butterflies, condors, ratios, calendars, diagonals, and related structures. The README frames the problem through an iron-condor question involving SPX, DTE, a profit target, and a stop loss, rather than presenting Optopsy as a general market-data terminal.
The library offers 38 named strategies. That range is useful for systematic screening because strike selection can be expressed in terms of option Greeks rather than fixed strike values. Each leg accepts a delta target with minimum and maximum bounds, so a strategy can select contracts from a target range instead of requiring every experiment to hard-code strikes. The supported constructions include single legs, straddles, strangles, vertical spreads, butterflies, ratio spreads, iron condors, condors, covered calls, protective puts, collars, calendars, and diagonals.
This is a research and backtesting tool, not an order execution system. The README does not describe submitting live orders. Its practical scope is to load historical option-chain records, construct strategy legs, inspect grouped statistics, and simulate how a defined set of entry, exit, sizing, and cost assumptions would behave. Results describe the dataset and model settings supplied to Optopsy. They do not establish that a strategy would receive corresponding fills in a brokerage account.
CSV Mapping and Optopsy Strategy Analysis
The central data flow starts with a DataFrame containing historical option-chain observations. `op.csv_data()` receives column indices rather than named schema fields. In the README example, index `0` is the underlying symbol, `2` is option type, `3` is expiration, `4` is quote date, `5` is strike, `6` is bid, and `7` is ask. This keeps ingestion configurable for differently arranged CSV files, but it also makes schema mistakes easier to introduce. A column index that points to the wrong field can produce a successful load and an invalid strategy definition.
After loading, a strategy function such as `op.long_calls(data)` analyzes matching combinations. The quick-start output groups results by days to expiration and delta range. It reports count, mean, standard deviation, minimum, quartiles, and maximum percentage returns for each visible group. This grouped view is the quickest documented route to screening many observations without first running a full portfolio simulation.
Optopsy extends this basic path with `simulate()`, which processes candidates chronologically, selects entries, tracks capital, enforces a maximum number of concurrent positions, and produces an equity curve. The documented selectors include `"nearest"`, `"highest_premium"`, and `"lowest_premium"`, plus a custom callable. A separate `simulate_portfolio()` function handles weighted multi-strategy simulations. That distinction matters: grouped analysis shows how observations fall into statistical ranges, while simulation shows how a portfolio rule set treats a sequence of selected trades. Researchers who conflate those outputs can mistake a descriptive dataset profile for an executable portfolio history.
Installing Optopsy and Loading the First DataFrame
The core package is installed from PyPI. The project supports Python 3.12 and 3.13, with `pyproject.toml` defining `requires-python = ">=3.12,<3.14"`. Runtime dependencies include Pandas, NumPy, `pandas-ta-classic`, `empyrical-reloaded`, Pydantic, Rich, `tabulate`, and `pytz`. A reader using an older Python interpreter must address that compatibility boundary before planning an adoption.
Install the library from a shell:
pip install optopsyAfter installation, create a CSV in the column order expected by the following call. The example loads the chain, applies the long-call analysis function, and prints a grouped result:
import optopsy as op

data = op.csv_data(
    "options_data.csv",
    underlying_symbol=0,
    option_type=2,
    expiration=3,
    quote_date=4,
    strike=5,
    bid=6,
    ask=7,
)

results = op.long_calls(data)
print(results)
A successful run should produce rows organized by `dte_range` and `delta_range`, with count and descriptive return statistics. The README displays an example result table, but its values depend on the dataset used in that example. A new analyst should inspect the loaded schema and verify one known contract by date, expiration, strike, type, bid, and ask before accepting aggregate results.
Chronological Optopsy Trade Simulation
For a strategy review based on sequential positions rather than isolated return groups, use `simulate()`. The documented configuration begins with `$100,000` of capital, one contract per entry, one concurrent position, and nearest-expiration selection. It also sets a maximum entry DTE of 45 and an exit DTE of 14. The returned object exposes `summary`, `trade_log`, and `equity_curve`, each serving a different review purpose.
The following is the README's documented simulation shape:
result = op.simulate(
    data,
    op.long_calls,
    capital=100_000,
    quantity=1,
    max_positions=1,
    selector="nearest",
    max_entry_dte=45,
    exit_dte=14,
)

print(result.summary)
print(result.trade_log)
print(result.equity_curve)
The summary is intended to contain win rate, profit factor, maximum drawdown, and other measures. The trade log records per-trade profit and loss, entry and exit dates, and equity. The equity curve shows portfolio value over time. Separate outputs let a researcher inspect aggregate behavior without losing the individual decisions that produced it.
Exit handling can also encode stop-loss, take-profit, and maximum holding days. Commission models support per-contract fees, a base fee, and minimum fees. These controls matter because a spread's apparent return can change after brokerage fees and fill assumptions are applied. The README also documents mid-price, spread-based, liquidity-based, and per-leg slippage models. None should be treated as an automatic prediction of an account's execution quality, because the repository does not claim that its built-in assumptions reproduce broker records.
Optopsy Signal Filtering and Risk Measurements
Optopsy can narrow entries with more than 80 technical-analysis signals supplied through `pandas-ta-classic`, including RSI, MACD, Bollinger Bands, EMA, ATR, and IV Rank. Applications can also use `custom_signal()` with a DataFrame and boolean flag column. Built-in indicators support rule-based screening, while the custom interface leaves the signal calculation under application control.
Risk analysis is exposed through `compute_risk_metrics()`. The documented measures include Sharpe, Sortino, value at risk, conditional value at risk, Calmar, Omega, and tail ratio. These calculations sit alongside the descriptive statistics returned by basic strategy analysis. This makes the library relevant when research extends beyond average return to drawdown or tail behavior. Still, the README excerpt does not specify every annualization setting, calculation convention, or edge-case treatment. Engineers embedding Optopsy in a controlled research pipeline may need to inspect the API reference for those definitions before comparing reports from different systems.
Portfolio simulation is available through `simulate_portfolio()` for weighted combinations of strategies. That is more useful than evaluating each strategy separately when capital allocation and portfolio-level constraints are part of the research question. The README does not provide a complete portfolio tutorial in the quoted installation and quick-start sections, so its exact weighting and capital treatment should be checked in the Examples and API Reference before use.
Optopsy Data CLI and Local Parquet Cache
The optional `data` extra adds a standalone command-line client and supporting packages for downloading and caching market data. Options downloads require `EODHD_API_KEY`, while stock history can be requested separately. Install the extra with:
pip install optopsy[data]The CLI can download one symbol or several at once:
optopsy-data download SPY
optopsy-data download SPY AAPL TSLA
optopsy-data download SPY --stocks
Downloaded data is cached under `~/.optopsy/cache/` as Parquet. According to the README, a repeated download requests only data added since the previous download. This incremental design reduces redundant transfers, but cache management remains part of operating the tool. The CLI can also filter its symbol listing:
optopsy-data symbols
optopsy-data symbols -q SPY
Cache size and deletion have dedicated commands:
optopsy-data cache size
optopsy-data cache clear
`cache size` lets an operator understand local storage use. `cache clear` is destructive to the cache, so it should be selected only when a full re-download is acceptable. The project also mentions live data providers and automatic gap detection, but the examples do not document provider authentication beyond `EODHD_API_KEY`. Users of another provider should consult the Data Management documentation to confirm that the provider, credentials, and required fields are supported.
Optopsy Limits, License, and Alternative Pipeline
Optopsy has a clear boundary as a Python backtesting library. It requires Python 3.12 or 3.13, compatible tabular data, and enough historical chain detail to construct multi-leg strikes. The README does not document order routing, exchange-calendar execution guarantees, broker reconciliation, or margin liquidation handling. Covered-call functionality can use stock data through `yfinance`, but that support does not turn the research core into a live brokerage interface. Research requiring a firm-specific fill model or operational execution controls may need another layer.
A real alternative is to implement strategy construction and backtesting directly in Pandas around a broker or data provider. That approach gives an organization control over schemas, calendars, execution timing, and portfolio accounting, but it also makes strike selection, leg matching, statistics, exit rules, and equity accounting application responsibilities. Optopsy removes much of that repeated construction work for its 38 built-in strategies and packages the functions as reusable Python code. The choice is between options-specific tooling and a custom DataFrame pipeline, not between two identically scoped engines.
The project declares `AGPL-3.0-or-later`. That license identifier can affect modified distribution and network-service obligations depending on the deployment. This is not legal advice; an organization should compare its intended use with the repository's actual license text. The `ui` extra adds Chainlit, LiteLLM, database packages, and Plotly, which creates more dependencies than the research core.
The repository is not archived, and its last push was on 2026-06-30. The listed stable release is `v2.3.0`, dated 2026-03-02. Upgrade planning should account for Python's narrow supported range, Pandas and NumPy behavior, provider schemas, and optional packages. The repository also contains a Dockerfile that builds the UI with Python 3.13 and starts `optopsy-chat`, but container deployment is optional and separate from the core backtesting workflow.
Editorial conclusion
Optopsy fits Python researchers who already have compatible options-chain data and want repeatable comparisons across defined-leg strategies. It is a poor fit for users needing Python 3.11 or earlier, guaranteed exchange-calendar order execution, or a turnkey dataset without supplying data credentials or a provider. Before adoption, verify that a suitable source can supply the required quote, expiration, type, strike, bid, and ask fields in a form that `op.csv_data()` can load, then confirm that commission, slippage, exit, and capital assumptions match the intended strategy.
Frequently asked questions
What Python versions does Optopsy support?
Optopsy supports Python 3.12 and 3.13. Its `pyproject.toml` sets `requires-python = ">=3.12,<3.14"`.
How do I install Optopsy with its data download features?
Install the `data` extra with `pip install optopsy[data]`. Historical options downloads also require `EODHD_API_KEY`.
What data does Optopsy need for a CSV backtest?
The documented `op.csv_data()` call maps underlying symbol, option type, expiration, quote date, strike, bid, and ask to configurable column indices. The source CSV must follow those mappings.
Can Optopsy model stop-loss and take-profit exits?
Yes. The README states that early exits can use stop-loss, take-profit, and maximum-hold-days rules during simulation.
Which options strategies are included in Optopsy?
Optopsy documents 38 built-in strategies, covering single legs, straddles, strangles, verticals, butterflies, ratios, iron condors, condors, covered strategies, calendars, and diagonals.
Official sources
Add this badge to your README
If you maintain this project, the badge below links readers to this analysis and shows its maintenance status from the daily GitHub snapshot. Paste the markdown into your README; add ?metric=license or ?metric=stars to the image URL for a different field.

[](https://hysenlabs.com/projects/goldspanlabs-optopsy)Star history chart for your README
[](https://hysenlabs.com/projects/goldspanlabs-optopsy)Was this useful?