HyperDX: An Open Source Observability Stack Built on ClickHouse and OpenTelemetry
Resolve production issues, fast. An open source observability platform unifying session replays, logs, metrics, traces and errors powered by ClickHouse and OpenTelemetry.
At a glance
- What is it?
- HyperDX unifies logs, traces, metrics, session replays, and errors on top of any ClickHouse cluster, with a Kibana-like interface and OpenTelemetry support. It targets teams tired of expensive, siloed observability tools, but its deployment and schema assumptions deserve scrutiny.
- Who is it for?
- Adopt HyperDX if you already run ClickHouse or want a self-hosted observability stack that avoids per-TB pricing and vendor lock-in, and if you are comfortable with OpenTelemetry instrumentation. Do not adopt it if you need a managed, turnkey SaaS with minimal ops overhead, or if your team lacks ClickHouse tuning experience.
- Can I use it commercially?
- Yes. MIT is a permissive licence: you can use, modify and sell software built on it, as long as you keep its copyright and licence notices.
- Is it still maintained?
- Yes. The repository last received commits 1 day ago.
- What is it written in?
- Mainly TypeScript, according to GitHub's language statistics.
Answers come from the project's GitHub data, last synced on November 14, 2026, and from our analysis. They are not legal advice.
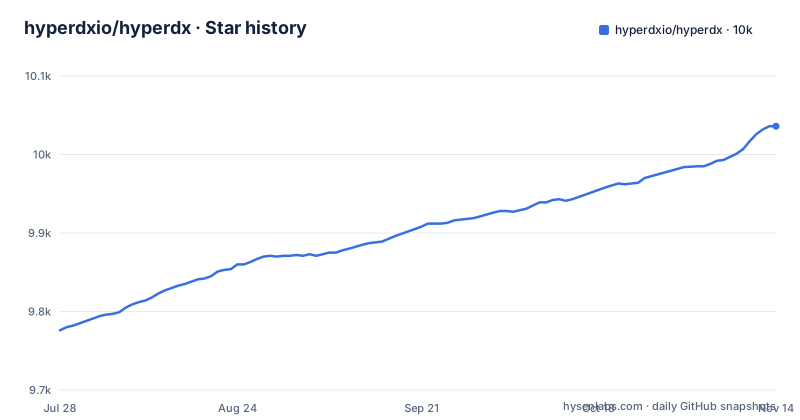
Star history
- hyperdxio/hyperdx10,036 ★ · +260
| Repository | 2026-07-28 | 2026-11-14 |
|---|---|---|
| hyperdxio/hyperdx | 9.8k | 10k |
260 Stars in the last 109 days, measured from the daily GitHub snapshot. Compare with other projects
Editorial analysis
What HyperDX Actually Solves
HyperDX is an open source observability platform that combines session replays, logs, metrics, traces, and errors into a single interface. The README positions it as a core component of ClickStack, a ClickHouse-backed observability stack, and compares it to Kibana but for ClickHouse. The problem it addresses is the fragmentation of observability tools: teams often jump between separate products for logs, APM, and session replay, stitching together clues manually. HyperDX also targets the cost problem, where commercial tools charge per terabyte and force teams to cut data collection. The intended user is an engineer who wants to search and visualize telemetry on top of an existing ClickHouse cluster, without adopting a proprietary query language or a separate storage engine. The project is schema agnostic, meaning it can work with your existing ClickHouse schema, which is a significant departure from tools that require a predefined data model.
How the Data Flow Works
HyperDX relies on OpenTelemetry as its ingestion standard. The README lists supported languages including JavaScript, Python, Java, Go, Ruby, PHP, .NET, Elixir, and Rust, and states that you can point your OpenTelemetry SDK to the collector at `http://localhost:4318`. The all-in-one container runs an OpenTelemetry Collector alongside the HyperDX API and UI, so telemetry flows from your instrumented app to the collector, then into ClickHouse. The README highlights full-text search and property search syntax like `level:err`, with SQL optional. The platform also supports live tailing of logs and traces.
Getting HyperDX Running
The quickest start is the all-in-one Docker image, which bundles ClickHouse, HyperDX, OpenTelemetry Collector, and MongoDB. The README gives this command: `docker run -p 8080:8080 -p 4317:4317 -p 4318:4318 docker.hyperdx.io/hyperdx/hyperdx-all-in-one`. After that, you visit `http://localhost:8080` to access the UI. The README warns that you need to open ports 8080, 8000, and 4318 on your firewall for the UI, API, and OTel collector, respectively, if you are behind a firewall. It also recommends at least 4GB of RAM and 2 cores for testing, which is a modest requirement for a stack that includes ClickHouse. For production, the README points to deployment docs that cover using an existing ClickHouse instance or deploying with ClickHouse Cloud. Instrumenting your app requires either the HyperDX SDKs for Browser, Node.js, and Python, or any OpenTelemetry SDK pointed at the collector. This dual path is flexible, but it means you must choose between HyperDX-specific SDKs and the vendor-neutral OpenTelemetry route.
The HyperDX CLI and Agent-Friendly Output
Beyond the web UI, HyperDX ships a command-line tool called `hdx`, installable via `npm install -g @hyperdx/cli`. The README describes an interactive TUI with vim-style keybindings for searching, live tailing, and viewing trace waterfalls. It can also render dashboard tiles and ad-hoc charts as ANSI output directly in the terminal. More interestingly, the CLI is positioned as agent-friendly: it supports raw SQL queries, NDJSON output, and Drain log pattern mining. This is a practical feature for scripting and for AI agents that need to consume telemetry data programmatically. The CLI requires authentication via `hdx auth login`, which suggests it connects to a HyperDX instance over the network.
Limitations and When It Is the Wrong Tool
HyperDX is not a fit for every team. First, it assumes you are willing to run and operate ClickHouse, or at least pay for ClickHouse Cloud. If you have no ClickHouse expertise, the operational burden of tuning clusters, managing shards, and handling high-cardinality data falls on you. The README's recommendation of 4GB RAM for testing is a hint that production workloads will demand significantly more. Second, the schema-agnostic promise is double-edged: while it works on top of your existing ClickHouse schema, that schema may not be optimized for HyperDX's query patterns. You may need to design or alter your schema to get the advertised search performance. Third, the README mentions that HyperDX collects anonymized usage data for open source deployments. This is a privacy consideration that some organizations will find unacceptable, especially for self-hosted infrastructure. Fourth, the project uses a contribution gate called Vouch, where a maintainer must vouch for you before your first PR is reviewed. This is a deliberate anti-spam measure, but it can slow down external contributions. Finally, the project is not a managed service; you are responsible for upgrades, backups, and security patches.
Alternatives and the ClickHouse Difference
The most direct alternative is Elastic Stack (Elasticsearch, Logstash, Kibana), which HyperDX explicitly evokes with the Kibana comparison. Elastic Stack is also open source, but it is built on Lucene-based search, not ClickHouse. The key difference is storage and query engine: Elasticsearch is optimized for full-text search with inverted indexes, while ClickHouse is a columnar OLAP database designed for analytical queries over large datasets. This means HyperDX's performance profile will differ from Elasticsearch, particularly for aggregations and high-cardinality metrics. Another alternative is SigNoz, which also uses ClickHouse and OpenTelemetry. If you are already invested in Elasticsearch, HyperDX would require a separate ClickHouse cluster, adding operational complexity. If you want a managed SaaS, alternatives like Datadog or Honeycomb are easier to adopt..
Maintenance, Licensing, and Upgrade Considerations
HyperDX is licensed under MIT, which is permissive and allows commercial use without copyleft obligations. That is a low-friction license for adoption. The project is actively maintained, with recent releases of `@hyperdx/[email protected]`, `@hyperdx/[email protected]` and `@hyperdx/[email protected]` on 2026-11-01. The repository is not archived, and the last push is recent, so maintenance appears ongoing. The README also notes that HyperDX collects anonymized usage data; this is a maintenance consideration because you may need to configure or disable it in your deployment, depending on your privacy policy.
Editorial conclusion
Adopt HyperDX if you already run ClickHouse or want a self-hosted observability stack that avoids per-TB pricing and vendor lock-in, and if you are comfortable with OpenTelemetry instrumentation. Do not adopt it if you need a managed, turnkey SaaS with minimal ops overhead, or if your team lacks ClickHouse tuning experience. Before committing, verify that your ClickHouse schema works with HyperDX's schema-agnostic queries, test the all-in-one container with your own telemetry volume, and review the anonymized usage data collection in the deployment docs.
Frequently asked questions
What is HyperDX?
It is an open source observability platform that helps engineers figure out why production is broken by making it easy to search and visualize logs and traces on top of any ClickHouse cluster, correlating logs, metrics, session replays, traces and errors in one place. It is a core component of ClickStack and OpenTelemetry is supported out of the box.
Is HyperDX open source?
Yes, under the MIT license, and the CLI is installable as @hyperdx/cli. Open source deployments collect anonymized usage data, and the project also offers a hosted path through ClickHouse Cloud.
how to use hyperdx
Run the all-in-one image with docker run -p 8080:8080 -p 4317:4317 -p 4318:4318 docker.hyperdx.io/hyperdx/hyperdx-all-in-one, then open http://localhost:8080 for the UI. Point your OpenTelemetry SDK at the collector at http://localhost:4318, forward ports 8080, 8000 and 4318 if the server is behind a firewall, and allow at least 4GB of RAM and 2 cores for testing.
what is hyperdx ui
The web UI is served on port 8080 and combines full-text and property search with a filter syntax such as level:err, dashboards over high cardinality events without a complex query language, alerts set up in a few clicks, and live tail for logs and traces. There is also a terminal front end: the hdx TUI with vim-style keybindings, plus ANSI rendering of tiles and charts.
What are some alternatives to HyperDX?
The README's Motivation section frames the problem in three parts: existing tools are expensive with pricing that fails to scale as telemetry grows into terabytes, they are hard enough to use that they need full-time SREs to set up and domain experts to operate, and they force you to hop between separate tools for logs, session replay, APM, and exceptions. HyperDX's answer to the third one is to correlate logs, metrics, session replays, and traces in a single search.
Official sources
Add this badge to your README
If you maintain this project, the badge below links readers to this analysis and shows its maintenance status from the daily GitHub snapshot. Paste the markdown into your README; add ?metric=license or ?metric=stars to the image URL for a different field.

[](https://hysenlabs.com/projects/hyperdxio-hyperdx)Star history chart for your README
[](https://hysenlabs.com/projects/hyperdxio-hyperdx)Was this useful?