Kubeshark: eBPF Traffic Indexing for Kubernetes, With an MCP Surface for Agents
eBPF-powered network observability for Kubernetes. Indexes L4/L7 traffic with full K8s context, decrypts TLS without keys. Queryable by AI agents via MCP and humans via dashboard.
At a glance
- What is it?
- Kubeshark captures and indexes cluster-wide L4/L7 traffic in the kernel with eBPF, decrypts TLS without key management, and exposes the result both to a dashboard and to AI agents over MCP. The interesting part is not the packet capture, it is the query layer built on top of it.
- Who is it for?
- Adopt Kubeshark if you run Kubernetes and your incident response keeps stalling because nobody can see east-west traffic: the Helm install is three commands, the query language spans Kubernetes identity, API context and network attributes in one filter, and the MCP server plus the network-rca skill give an agent a concrete data source instead of a guess.
- Can I use it commercially?
- Yes. Apache-2.0 is a permissive licence: you can use, modify and sell software built on it, as long as you keep its copyright and licence notices.
- Is it still maintained?
- Yes. The repository last received commits 3 days ago.
- What is it written in?
- Mainly Go, according to GitHub's language statistics.
Answers come from the project's GitHub data, last synced on November 12, 2026, and from our analysis. They are not legal advice.
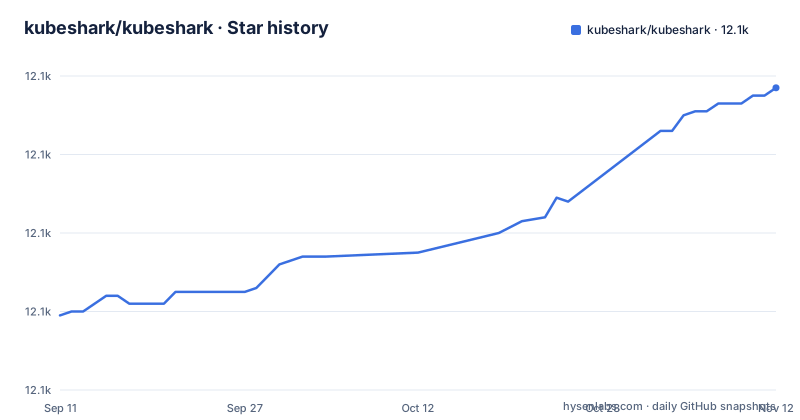
Star history
- kubeshark/kubeshark12,137 ★ · +58
| Repository | 2026-09-11 | 2026-11-12 |
|---|---|---|
| kubeshark/kubeshark | 12.1k | 12.1k |
58 Stars in the last 62 days, measured from the daily GitHub snapshot. Compare with other projects
Editorial analysis
The gap Kubeshark targets: east-west traffic that no service mesh dashboard shows
Most Kubernetes observability stacks tell you what a service thinks happened. Metrics, traces and logs are produced by the application or by a sidecar, which means the data is filtered through instrumentation you had to write, inject or configure. When a request fails between two pods and neither side logs an error, or when a retry storm appears between services that never emit a trace span, the telemetry simply does not exist. Kubeshark takes the opposite position. It captures traffic at the kernel level with eBPF and parses it according to protocol specifications, so the data source is the wire rather than the application. The README frames the output as answers to queries using network, API and Kubernetes semantics, and the tagline is explicit about the audience: SREs and AI agents. That is a narrower and more honest target than general observability. If your problem is a slow database query inside one service, an APM tool is a better fit. If your problem is that you cannot see which workload is talking to which, at what rate, over which protocol, with what payload, Kubeshark is aimed squarely at that.
How the pieces fit: eBPF capture, L7 dissection, indexing, then query
The data flow has four stages. First, eBPF programs in the kernel capture packets cluster-wide, which is what makes the approach instrumentation-free. Second, traffic is dissected at L7: the README lists HTTP, gRPC, GraphQL, Redis, Kafka and DNS among supported protocols, and describes real-time and delayed L7 indexing with request/response matching and full payloads. Third, the indexed records are joined with Kubernetes context, which is the step that turns packets into something an operator can reason about. A TCP flow between two IPs becomes a call from a named workload in a namespace to another named workload. Fourth, the result is exposed through two front ends: a real-time dashboard and an MCP server. The query language, KFL, is described as CEL-based and able to combine Kubernetes identity, API context and network attributes in a single filter. That combination is the actual product. Packet capture tools have existed for decades; what Kubeshark adds is the join between packet-level facts and cluster-level identity, plus a query surface that does not require you to know which pod IP mapped to which workload at the time of the incident.
Getting it running: Helm, Homebrew, port-forward and the MCP registration
The README gives a three-command path for a first look. Add the chart repository, install the chart, then forward the front-end service:
helm repo add kubeshark https://helm.kubeshark.com helm install kubeshark kubeshark/kubeshark kubectl port-forward svc/kubeshark-front 8899:80
The dashboard is then at http://localhost:8899. The README notes that for production use an ingress controller is recommended instead of port-forward, which is a sensible default given that port-forward ties the session to a local process. There is a second install route via Homebrew, where the binary itself runs the capture: brew install kubeshark followed by kubeshark tap. For AI agents, the registration is a single command against the MCP client, shown in the README as claude mcp add kubeshark -- kubeshark mcp. Note that the Homebrew path installs the CLI, and the MCP subcommand is part of that same binary, so an agent and a human can be pointed at the same cluster from the same machine. Beyond these, the README points to an installation guide and an ingress page rather than listing chart values inline, so the tunable configuration lives in the docs, not in the repository front page.
TLS decryption without keys, and the policy question that follows
The most consequential claim is that Kubeshark decrypts TLS and mTLS traffic using eBPF, with no key management and no sidecars. The README states this plainly and lists it as a feature, and also says decrypted traffic is included in snapshots. The practical implication is that you do not have to distribute certificates or terminate TLS in a proxy to see payloads. The other implication is that any capture layer with this property is, by construction, a place where sensitive data concentrates. If you operate under rules about where cardholder data or personal data may be stored, the snapshot feature is the part to examine first, because the documentation states snapshots can be written to S3, Azure Blob or GCS for long-term retention and cross-cluster sharing. Who can read that bucket becomes part of your data handling surface.
KFL and the MCP server: two query surfaces over the same index
Kubeshark exposes one index through two interfaces with different ergonomics. For humans, KFL is a CEL-based language where a single query can mix Kubernetes selectors, API-level fields and network attributes. The README links a KFL reference and a traffic indexing page, which is where the actual field names live; the front page shows the concept rather than the grammar. For agents, the MCP server exposes the same cluster-wide network data, and the README's example questions are the useful part because they show the intended shape of the workload: why did checkout fail at a given time, which services have error rates above a threshold, what are the TCP retransmission rates across node-to-node paths, and tracing a specific request ID through all services. Those are retrospective questions, and the repository also ships two open-source skills, network-rca for retrospective root cause analysis (snapshots, dissection, PCAP extraction, trend comparison) and kfl for writing and debugging filters. The skills are installable as a Claude Code plugin via /plugin marketplace add kubeshark/kubeshark and /plugin install kubeshark. The honest caveat: an agent querying this data is only as good as the index behind it, and the README does not state how long the live index retains records by default. That is a question for the snapshots documentation.
Where it is the wrong tool, and what to compare it against
Kubeshark is a cluster-wide capture system, and that is also its main constraint. Running eBPF capture and L7 dissection on every node costs CPU and memory, and the more protocols you dissect with full payloads, the more it costs. The only responsible position is that you must measure the overhead in your own cluster before leaving it installed permanently. The second constraint is scope: it observes network traffic, so a bug that never crosses the wire, such as a bad in-process cache or a slow disk read, is invisible to it. The third is that decrypted payload retention is a governance decision, not just a technical one.
The natural alternative is a service mesh with its own telemetry, commonly Istio plus Prometheus and a tracing backend. The difference in approach is structural. A mesh intercepts traffic through sidecars or per-node proxies that you deploy and configure, and it produces metrics and traces about the requests it proxies. Kubeshark does not sit in the request path at all; it observes from the kernel. That means no proxy to inject, no application change, and visibility into traffic the mesh does not proxy, including DNS and non-HTTP protocols like Redis and Kafka. The trade-off runs the other way too: a mesh gives you policy enforcement, mutual TLS identity and traffic shaping, none of which Kubeshark does. It is an observer, not a control point. Teams that already run a mesh should treat Kubeshark as complementary rather than a replacement.
Maintenance, release cadence and the Apache-2.0 boundary
The version numbering is unusual: the recent releases are v53.6.0 (2026-10-21), v53.5.0 (2026-10-07) and v53.4.0 (2026-08-13). A major version in the fifties signals a project that has been through many iterations rather than one that just started, and the listed releases arrive weeks to a couple of months apart. The repository is not archived and the last push was on 2026-11-01, so the project is active. For an operator, the practical upgrade question is what changes between minor versions in a system that installs kernel-level programs: eBPF code is sensitive to kernel versions, and the docs include an air-gapped page, so checking kernel and CNI compatibility should be part of any upgrade, not just the first install. On licensing, the repository is Apache-2.0, which permits commercial use and modification and includes a patent grant; it does not impose copyleft on your own code. That says nothing about the legality of capturing and storing traffic on your network, which is governed by your own policies and, in some jurisdictions, by law. This is not legal advice, and the licence text is the authority, not this paragraph.
Editorial conclusion
Adopt Kubeshark if you run Kubernetes and your incident response keeps stalling because nobody can see east-west traffic: the Helm install is three commands, the query language spans Kubernetes identity, API context and network attributes in one filter, and the MCP server plus the network-rca skill give an agent a concrete data source instead of a guess. Do not adopt it as a permanent always-on capture layer without first measuring the CPU and storage cost of the worker pods in your own cluster, and do not treat the TLS decryption as free of policy consequences. Before you commit, verify three things: the exact KFL syntax in the docs for the version you install, how snapshots are stored and where (S3, Azure Blob or GCS) and who can read that bucket, and whether your cluster's CNI and kernel versions are supported, since the README lists no kernel or CNI requirements. The licence is Apache-2.0, so the code itself carries no copyleft obligation, but the traffic you capture may be governed by other rules entirely.
Frequently asked questions
How do I install kubeshark?
Add the Helm repo and install the chart, then forward the front service to a local port: helm repo add kubeshark https://helm.kubeshark.com, helm install kubeshark kubeshark/kubeshark, kubectl port-forward svc/kubeshark-front 8899:80. For production the project recommends an ingress controller instead of port-forward. Homebrew and a binary download from the releases page are the other two routes.
how to install kubeshark
The install table lists three methods: Helm via the kubeshark repo, Homebrew with brew install kubeshark && kubeshark tap, and a binary download from the releases page. The quick start uses Helm and finishes with a port-forward to svc/kubeshark-front.
what is kubeshark
Kubeshark indexes cluster-wide network traffic at the kernel level with eBPF, parses it by protocol including HTTP, gRPC, Redis, Kafka and DNS, and attaches Kubernetes context to the result. It decrypts TLS without key management, exports PCAPs, and serves the data to a dashboard, to KFL queries and to AI agents over MCP.
how to use kubeshark
Query the index with KFL, a CEL-based language combining Kubernetes, API and network semantics, or browse it in the dashboard and the workload dependency map. For agents, register the CLI as an MCP server and optionally add the Network RCA and KFL skills as a Claude Code plugin.
is kubeshark free
The repository is licensed under Apache-2.0 and the source is published on GitHub with a Helm chart, Homebrew taps and release binaries. The README also lists it as 100% on-premises, with air-gapped support and no external dependencies.
Official sources
Add this badge to your README
If you maintain this project, the badge below links readers to this analysis and shows its maintenance status from the daily GitHub snapshot. Paste the markdown into your README; add ?metric=license or ?metric=stars to the image URL for a different field.

[](https://hysenlabs.com/projects/kubeshark-kubeshark)Star history chart for your README
[](https://hysenlabs.com/projects/kubeshark-kubeshark)Was this useful?