Lieflat Charts: an Agent Skill that turns data into HTML charts and full-page reports
Data visualization Skill for AI Agents, turning data into polished, interactive HTML charts.
At a glance
- What is it?
- Lieflat Charts is a SKILL.md-format data visualization skill for AI agents, built around three visual systems (Lupi, Glance, Basics) plus interactive graph templates and twelve report layouts. The judgement: it is a styling and layout layer, not a charting engine, and its licence status is unresolved.
- Who is it for?
- Adopt Lieflat Charts if you already run an agent that reads SKILL.md files and you need editorial-quality HTML output rather than an interactive dashboard product; skip it if you need a programmatic charting library with a stable API, or if your organisation cannot ship code under an unresolved licence.
- Can I use it commercially?
- Check first. The repository uses a licence we do not classify automatically, so read its LICENSE file before any commercial use.
- Is it still maintained?
- Yes. The repository last received commits 3 days ago.
- What is it written in?
- Mainly HTML, according to GitHub's language statistics.
Answers come from the project's GitHub data, last synced on November 15, 2026, and from our analysis. They are not legal advice.
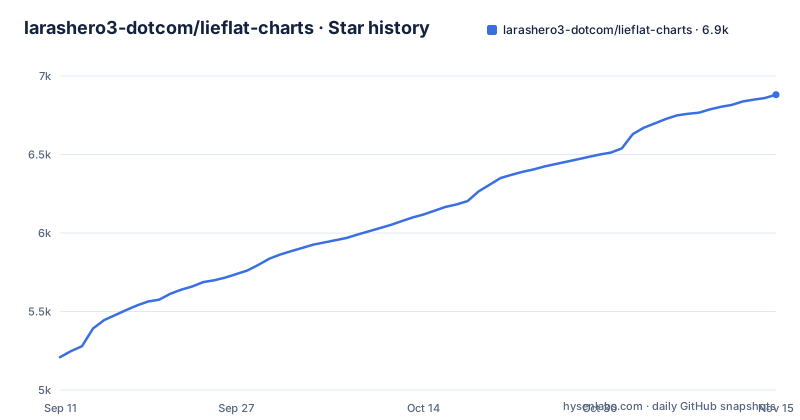
Star history
- larashero3-dotcom/lieflat-charts6,881 ★ · +1,672
| Repository | 2026-09-11 | 2026-11-15 |
|---|---|---|
| larashero3-dotcom/lieflat-charts | 5.2k | 6.9k |
1,672 Stars in the last 65 days, measured from the daily GitHub snapshot. Compare with other projects
Editorial analysis
What problem Lieflat Charts addresses
Most charting tooling assumes a developer writes code against an API and controls every parameter. Lieflat Charts assumes the opposite: an AI agent has the data and needs to produce a finished, presentable HTML artifact without a human tuning axis labels, spacing or type. The README describes it as a data visualization and report generation skill that follows the Agent Skills format, usable from Claude Code, Codex and other agents that are compatible with SKILL.md.
The intended user is therefore not a data engineer building a dashboard product. It is someone who already talks to an agent and wants the agent's output to look like an edited page rather than a default library render. The README is explicit that the default behaviour is a chart with an editorial feel, and that full-page HTML reports are generated only when the user explicitly asks for a report, annual review, monthly report, whitepaper, poster or brief. That distinction matters: the skill does not volunteer a twelve-page report when you asked for one bar chart.
The three visual systems and what separates them
The skill's core design decision is that a single house style would be wrong for every dataset, so it ships three named systems. Lupi is described as the editorial narrative style: thin lines, dot grids, record-by-record presentation and generous whitespace, with an emphasis on real units, detail and marginal notes. The README positions it for papers, long-form writing, annual reports and data stories that are meant to be read slowly. Glance is the fast-judgement style: thick bars, large numerals, colour blocks and clear ordering, aggregating the information up front so a reader grasps highs, lows, changes and anomalies within seconds. It is positioned for weekly reports, briefings and dashboards. Basics keeps familiar outlines (bar, line, donut) and adds countable scales, hairline rules and editorial typography, for content that is structurally simple or small in volume.
Alongside those, the repository provides standalone interactive large-format charts for network, path and multi-segment flow data. The README states that every chart tries to preserve the real units of the data while letting titles, marginal notes, sources and page structure participate in the expression. That is a coherent position, and it is also the source of the main constraint: the skill is opinionated about typography and rhythm, so if your organisation already has a design system, the output will compete with it rather than inherit from it.
Colour: Mono as the fallback, three presets, and custom palettes
Version 1.1.0 added colour mode, and the README is careful about how it is selected. The agent chooses between Mono (black, white, grey) and a colour preset based on the data structure and the usage scenario, without requiring the user to ask for colour first. The mapping given is specific: an ordered single series can use Porcelain (青瓷蓝), a small number of unordered categories can use Palm (椰林绿), and when a controlled focal point is needed, Wire (编辑部红) applies. When the fit is unclear, the skill falls back to Mono. If the user supplies brand colours or explicit colour values, a custom palette can be built.
One rule is stated as absolute: a single HTML file, or a single set of charts, uses only one colour system. The README also notes that after generation you can keep adjusting colours while preserving chart structure, proportions, contrast and the data contract, but that any adjustment requires re-checking contrast, visual hierarchy and what the colour is asserting about the data. That last sentence is the honest part of the feature. Colour in a chart is a claim, and the skill treats re-colouring as a review step rather than a cosmetic one.
Report mode: twelve full-page templates in Chinese and English
Version 1.2.0 added report mode, which moves the skill beyond single charts. The README states that twelve full-page report templates are available, each in a Chinese and an English version, covering research reports, research briefs, business data reports, financial and economic analysis, product records, dashboards, posters, and personal records such as sport and travel logs. The README points to report-catalog.md and templates/reports/index.html as the index of the report templates.
The README adds a caveat that is worth taking at face value: template names represent a layout character, not a restriction on use cases, and the same template can migrate to a different kind of report depending on the data structure. That is a reasonable framing, but it also means the twelve names are a starting index rather than a guarantee that any given template will fit an arbitrary dataset without layout work.
Getting it running: the SKILL.md path
What the README does state is the integration mechanism: Lieflat Charts follows the Agent Skills format and is usable by Claude Code, Codex and other AI agents compatible with SKILL.md. So the practical installation step is placing the skill where your agent discovers skills, and the artifact the agent produces is HTML.
One concrete path is a template URL: the README links to templates/big-force.html, hosted at larashero3-dotcom.github.io/lieflat-charts/templates/big-force.html, described as a Force Graph template for experiencing drag and zoom. That path tells you two things about the repository layout. Templates live under templates/ and are plain HTML files that can be opened directly in a browser, which is consistent with the stated primary language of the repository being HTML. It also means the fastest way to evaluate the project before wiring it into an agent is to open that file and judge the output yourself.
The README gives a one-command install, `npx skills add https://github.com/larashero3-dotcom/lieflat-charts --skill lieflat-charts`, or a prompt asking an agent with shell access to clone the repository into `~/.claude/skills/lieflat-charts` (or `~/.codex/skills/lieflat-charts` for Codex) and check that SKILL.md, templates/, catalog.md and mono-tokens.js exist. Updating is a `git pull` in that directory.
Where this is the wrong tool
The first limitation is scope. Lieflat Charts produces HTML artifacts. If you need a live dashboard that re-queries a database, or a chart embedded in a React application with event handlers your code controls, this is the wrong layer. The output is a page, and the README frames reports as publishable HTML, which is a different contract from a component library.
The second is determinism. The agent selects the visual system and the colour preset from the data structure and scenario, and falls back to Mono when the fit is unclear. That is a design choice with a cost: two runs over similar data may not produce the same styling. If you need byte-identical output across runs, you would have to constrain the agent's instructions yourself.
The third is the licence. The repository metadata reports NOASSERTION, which means no licence was recognised by the tooling that produced that metadata. The repository root carries a LICENSE file and a THIRD_PARTY_NOTICES.md. I am not giving legal advice, but the practical implication is straightforward: you cannot treat the terms as known until you read the actual licence file in the repository. For internal experiments that may be tolerable; for redistribution or embedding in a commercial product it is a blocking unknown.
How it differs from a charting library such as ECharts or Chart.js
The comparison that matters is with a JavaScript charting library. Take ECharts or Chart.js: both are libraries you call from code, both give you a documented option object or config schema, and both put the visual decision in your hands. You set the series type, the axes, the palette and the tooltip behaviour. Rendering is deterministic given the same input, and the library is a dependency your build system resolves.
Lieflat Charts sits a layer above them: its own template table lists Chart.js and ECharts, alongside hand-written SVG, as the implementation behind its templates. The visual decision is delegated to an agent that picks among Lupi, Glance and Basics and among Mono, Porcelain, Palm and Wire. The output is a finished HTML file rather than a mounted chart instance. The advantage is that a non-designer gets a coherent page without writing styling code. The cost is that you lose the programmatic control surface, and you inherit the agent's judgement as part of your build. If your requirement is "render this series with these exact axis ticks every time," a library is the correct answer and this skill is not.
Maintenance, versioning and what to check before adopting
The release history shows two releases in August 2026: v1.1.0 on 2026-08-05 adding colour mode, and v1.2.0 on 2026-08-14 adding report mode. The repository's last push is 2026-11-02, and it is not archived. That is a short history with two feature releases in nine days, which suggests active development but gives no evidence about long-term stability or how breaking changes will be handled.
Upgrade cost is hard to estimate. Because the skill emits standalone HTML rather than a linked dependency, an upgrade does not break your runtime the way a library major version would. It changes what the agent produces next time. That means the migration risk sits in your review process, not your build. The concrete checks I would run before adopting: read the licence file, since the metadata says NOASSERTION; confirm your agent version supports the SKILL.md format the skill declares; and open templates/big-force.html directly to confirm the interactive output renders in the browser you actually publish to. If any of those three fails, the rest of the feature list does not matter.
Editorial conclusion
Adopt Lieflat Charts if you already run an agent that reads SKILL.md files and you need editorial-quality HTML output rather than an interactive dashboard product; skip it if you need a programmatic charting library with a stable API, or if your organisation cannot ship code under an unresolved licence. Before adopting, verify the actual licence terms for the repository (the metadata reports NOASSERTION), confirm that your target agent version supports the SKILL.md format the skill declares, and open one template such as templates/big-force.html to check that the output renders correctly in your publishing pipeline.
Frequently asked questions
What is the lieflat-charts skill?
A data visualisation skill in the Agent Skills format that turns data into interactive HTML charts, usable in any tool that reads that format. Its default output is a chart, and it produces full-page reports only when the request explicitly asks for a report, annual report, white paper, poster or brief.
Which visual styles does lieflat-charts offer?
Three named styles: an editorial one built on thin lines and per-record detail for slow reading, a quick-judgement one built on thick bars and large numerals for dashboards, and a basics one that keeps familiar chart silhouettes with countable ticks. A fourth group covers network, path and flow data with hover, focus and dragging.
How many templates does lieflat-charts ship?
The inventory table counts fifteen editorial, thirteen basics, eighteen quick-judgement and three interactive chart templates, plus three colour presets with fifteen swatches and twelve bilingual report templates. The preview section above it quotes larger numbers for the first three families, so the two parts of the readme disagree and the files are the reliable count.
How do I install lieflat-charts?
With one command run through a package runner that adds the skill from the repository by name, or by pasting a paragraph to an agent with shell access telling it to clone the repository into a skills directory under your home folder and check that the skill file, the templates directory, the catalogue and the token file exist. A second agent tool uses a different path, and updates are a pull in the installed directory.
How many charts should I ask lieflat-charts for?
The count follows the number of independent conclusions: one chart for a single question, two or three for that many conclusions, four to six for a full article, and at most six for a single page by default. It will follow a number you specify, but it states that it will not repeat a conclusion to reach the count.
Official sources
Add this badge to your README
If you maintain this project, the badge below links readers to this analysis and shows its maintenance status from the daily GitHub snapshot. Paste the markdown into your README; add ?metric=license or ?metric=stars to the image URL for a different field.

[](https://hysenlabs.com/projects/larashero3-dotcom-lieflat-charts)Star history chart for your README
[](https://hysenlabs.com/projects/larashero3-dotcom-lieflat-charts)Was this useful?