Russia-Ukraine Equipment Loss Tracker: An R-Based Visual Analysis of Oryx Data
Equipment Loss Tracking
At a glance
- What is it?
- This R project turns Oryx's verified equipment loss data into cumulative charts, ratios, and maps, with a strict empirical approach. It is a useful reference for analysts, but its lagging data and lack of statistical modeling depth limit its use for real-time assessment.
- Who is it for?
- Adopt this tracker if you need a transparent, reproducible visualization of Oryx's verified equipment losses, especially for long-term trend analysis or educational purposes. Do not use it for real-time operational assessment, as data lags by days and undercounts losses in contested areas.
- Can I use it commercially?
- Yes. MIT is a permissive licence: you can use, modify and sell software built on it, as long as you keep its copyright and licence notices.
- Is it still maintained?
- Yes. The repository received new commits within the last day.
- What is it written in?
- Mainly R, according to GitHub's language statistics.
Answers come from the project's GitHub data, last synced on October 23, 2026, and from our analysis. They are not legal advice.
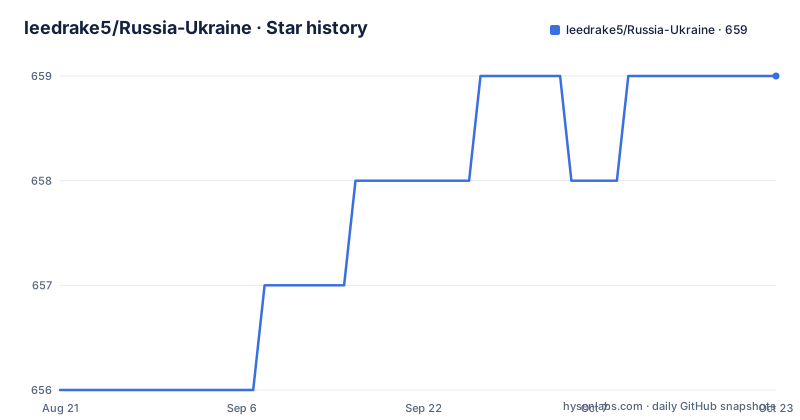
Star history
- leedrake5/Russia-Ukraine659 ★ · +3
| Repository | 2026-08-21 | 2026-10-23 |
|---|---|---|
| leedrake5/Russia-Ukraine | 656 | 659 |
3 Stars in the last 63 days, measured from the daily GitHub snapshot. Compare with other projects
Editorial analysis
What This Tracker Does and Who It Serves
The repository is a focused R project that turns Oryx's independently verified equipment loss data into a set of visualizations. It addresses a specific problem: the raw Oryx list is a long, tabular inventory, and making sense of cumulative trends, ratios, and category breakdowns requires aggregation and plotting. The target audience is analysts, journalists, and researchers who want a quick, reproducible view of equipment loss dynamics without building the scraping and charting pipeline themselves. The README is explicit that this is empirical, not interpretive, analysis. That means it does not adjust for potential bias or attempt to estimate true losses beyond what photo or video evidence supports. For someone who needs a defensible, source-linked overview, this project saves hours of work. For someone who wants a predictive model or a correction for undercounting, it is not the right starting point.
Data Flow: From Oryx to Google Sheets to R
The mechanism is a daily pipeline. A scraper tool, written by Daniel Scarnecchia, pulls data from Oryx's site. That scraped data is pushed to a public Google Sheet. The sheet performs synthetic calculations for equipment categories, which the README says is done to preserve transparency. The R code in this repository then reads that sheet to generate plots. The data is a lagging indicator, as the README notes, because it depends not only on when equipment is lost but also on when it is discovered and documented. This is a critical constraint. A loss that occurs today might not appear for days or weeks, especially if the area is under Russian control and photo documentation is sparse. The pipeline is not real-time; it is a periodic snapshot that reflects the pace of verification. The use of a Google Sheet as an intermediate layer is a deliberate choice for transparency, but it also means the R code depends on an external, mutable resource. If the sheet changes format or access, the project breaks.
Running It: Commands and Configuration
The README does not provide explicit installation or run commands. It describes the data source and the analysis approach, but it does not show how to clone, install dependencies, or execute the R scripts. This is a gap. A typical R user would need to clone the repository, open the project in RStudio or another R environment, and install packages such as ggplot2, dplyr, and mgcv for the general additive model. The README mentions that synthetic calculations are performed in the Google Sheet, so the R code likely reads the sheet directly, possibly via the googlesheets4 package. Without explicit instructions, the user must infer the workflow from the repository structure. The annual comparisons are available in a separate README, and period-specific files like 1_invasion_2022.md exist. Those markdown files likely contain the charts and commentary. To reproduce the main plots, you would need to set up Google Sheets API credentials if the sheet is private, though it is public. The lack of a setup guide is a real drawback for a project that claims transparency.
Visualization Approach and Statistical Method
The core plots show cumulative losses for Russia and Ukraine, with red for Russia and blue for Ukraine. Bars represent daily losses, and a line represents a general additive model smooth on cumulative losses. The shaded grey band is a 95% confidence interval based on point scatter. This is a reasonable way to show trend and uncertainty, but it is not a causal model. The README explains the ratio of losses, which started near 1:1 and then shifted to about 3.5:1 in the first months, reaching 4:1 after the Kharkiv Offensive and declining to around 3.12 by early 2023. These ratios are descriptive, not inferential. The GAM smooth is a smoothing technique, not a forecast. The confidence band reflects variation in the data, not uncertainty about the true loss count. This distinction matters. An analyst might mistake the narrow band for precision, when in fact it only reflects the scatter of documented losses. The README does not claim more, but the visual presentation could be misinterpreted by casual readers.
Limitations: Undercounting, Lag, and Scope
The README openly acknowledges that the data undercounts losses, especially Ukrainian losses. It notes that pro-Russian sources are monitored, but areas under Russian control are less likely to have photo documentation. There is no attempt to adjust numbers with a modifier. This is a genuine limitation. The tracker is only as good as Oryx's verification, and Oryx's list excludes small arms, munitions, civilian vehicles, trailers, and derelict equipment. ATGMs and MANPADS are included in the list but not in the ultimate count. This means the totals are a lower bound, not an estimate of actual losses. The lag is another limitation. The data is updated based on the last update for each day, so it is a lagging indicator. For someone tracking the war in near real time, this project is useless. It is better suited for retrospective analysis. The README also notes that early swings in the ratio are impacted by Oryx and his team keeping up with data, so the first weeks of the war have less reliable ratios.
Alternatives: Direct Oryx Access and Other Trackers
The most obvious alternative is to use Oryx's website directly. The site provides the same verified list, and you can manually filter by country, status, and category. The difference is that Oryx's site does not offer cumulative trend charts or ratio calculations. You would have to build those yourself. Another alternative is the scraping tool by Daniel Scarnecchia, which is the same tool this project uses. You could run that scraper and then do your own analysis, giving you full control over the data processing. The difference is that this project adds the Google Sheet layer and the R visualization, which saves time but also introduces a dependency on the sheet's format. A third alternative is to use other open-source war trackers, such as those based on ACLED or the Institute for the Study of War, but those focus on events and control, not equipment losses. The key difference is that this project is narrowly scoped to equipment, while others cover broader conflict dynamics.
Maintenance, License, and Upgrade Cost
The repository is under the MIT license, which permits reuse with attribution and no copyleft obligations. That is a low-license-risk choice for most users. The project is not archived, but the last push date is unknown, and there are no recent releases. This is a concern. The README mentions that the war has gone on for years and that annual comparisons are available, which suggests the author has been updating it. However, without a release history or a clear commit frequency, you cannot be sure how actively it is maintained. The data pipeline depends on external sources: Oryx's site, the scraper tool, and the Google Sheet. If any of those change, the project may break. The upgrade cost is moderate. You would need to monitor the Google Sheet for schema changes and update the R code accordingly. The period-specific files, such as the winter 2023 offensive, suggest that the author adds new sections as the war evolves, but that also means the repository grows in complexity. For a one-off analysis, this is fine. For long-term use, you need to verify that the data source remains accessible and that the author continues to update the sheet.
Editorial conclusion
Adopt this tracker if you need a transparent, reproducible visualization of Oryx's verified equipment losses, especially for long-term trend analysis or educational purposes. Do not use it for real-time operational assessment, as data lags by days and undercounts losses in contested areas. Before relying on it, verify the last update date of the linked Google Sheet and check whether the annual and period-specific files match your needs. The project's value lies in its disciplined, empirical presentation, not in causal inference or predictive power.
Frequently asked questions
How much is Russia losing in the war?
On the tracked equipment data, the total loss ratio moved to about 4:1 in Russia's favour after the Kharkiv offensive and then declined to roughly 3.12 by the start of 2023. Category ratios sit near 3.1:1 for destroyed, abandoned and captured equipment, and about 9:1 at the peak for abandonment in summer 2022. The project states the underlying data probably undercounts Ukrainian losses.
Where does the data in leedrake5/Russia-Ukraine come from?
From Oryx's public list of independently verified equipment, which covers only destroyed vehicles and equipment with photographic or video evidence. The project scrapes that source daily with a community tool, pushes the rows to a public Google spreadsheet, and performs the category calculations in the spreadsheet so the arithmetic stays visible.
Why does leedrake5/Russia-Ukraine say the data is a lagging indicator?
Because the series reflects when a loss was documented and picked up by the daily update, not when the equipment was lost. Documentation is itself delayed, and areas under Russian control are less likely to be photographed, which is the project's stated reason for expecting Ukrainian losses to be undercounted.
What does the grey band mean in the Russia-Ukraine charts?
It is a 95 percent confidence interval computed from the scatter of the plotted points around the smoothed additive model. A wider band means more uncertainty in the underlying record and a narrower band means less. Points are cumulative daily losses, red for Russia and blue for Ukraine, and bars show daily losses.
What is excluded from the Russia-Ukraine equipment counts?
Anything without photo or video evidence is excluded, along with small arms, munitions, civilian vehicles, trailers and derelict equipment including aircraft. Anti-tank guided missiles and man-portable anti-aircraft weapons appear in the list but are left out of the final count, and equipment produced before 1991 is marked as Soviet.
Official sources
Add this badge to your README
If you maintain this project, the badge below links readers to this analysis and shows its maintenance status from the daily GitHub snapshot. Paste the markdown into your README; add ?metric=license or ?metric=stars to the image URL for a different field.

[](https://hysenlabs.com/projects/leedrake5-russia-ukraine)Star history chart for your README
[](https://hysenlabs.com/projects/leedrake5-russia-ukraine)Was this useful?