JDK Mission Control: profiling a live Java application
https://openjdk.org/projects/jmc OpenJDK Mission Control, a production time profiling and diagnostics tools suite.
At a glance
- What is it?
- JDK Mission Control is the OpenJDK production profiling and diagnostics suite for Java, with a workbench for browsing Java flight recordings, an automated rules analysis, a JMX console and a heap waste report, and a core API that can do the same work headless from a script. Getting a build means choosing a downstream vendor, because this repository ships source rather than binaries.
- Who is it for?
- Adopt JDK Mission Control when you need to understand a running Java process beyond what a log tells you, and when you can point it at a Java flight recording rather than attaching to a live JVM, because the headless core API is the part that fits into a pipeline.
- Can I use it commercially?
- Not without permission. GitHub finds no licence file in the repository, and without a licence all rights are reserved by default: you may read the code but not reuse it. Check the README, or ask the authors, before using it.
- Is it still maintained?
- Yes. The repository last received commits 4 days ago.
- What is it written in?
- Mainly Java, according to GitHub's language statistics.
Answers come from the project's GitHub data, last synced on November 7, 2026, and from our analysis. They are not legal advice.
Star history
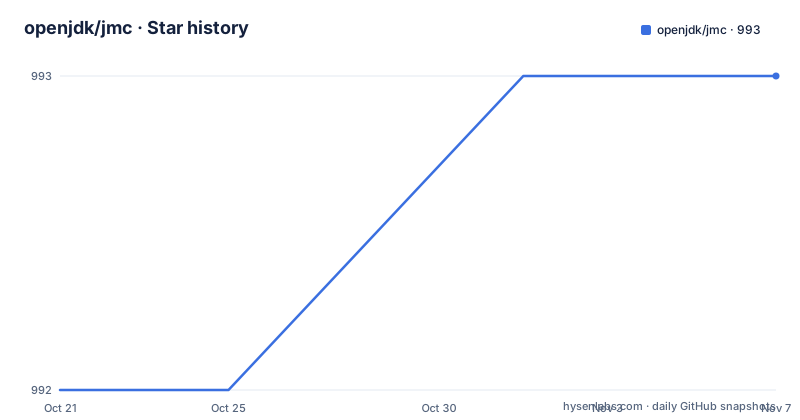
- openjdk/jmc993 ★ · +1
| Repository | 2026-10-21 | 2026-11-07 |
|---|---|---|
| openjdk/jmc | 992 | 993 |
1 Stars in the last 17 days, measured from the daily GitHub snapshot. Compare with other projects
Editorial analysis
The production diagnostic suite for the JVM
Mission Control is described in the README as an open source production time profiling and diagnostics tool for Java. It lives under the openjdk organisation, which means it is developed in the open as part of the platform rather than shipped by a single vendor, and the project wiki at wiki.openjdk.java.net is where the documentation lives alongside the code.
What it is for is narrower than a general debugger. A debugger attaches to a process and lets you step through it, which is a development activity. Mission Control is about a production process that is misbehaving, where you cannot attach a debugger to a running server without more disruption than the problem itself, and where the question is what happened in the last five minutes rather than what happens on the next line.
The primary data source is the Java flight recording, the JFR mechanism built into the JVM. A recording is a file containing events the JVM emitted: method samples, lock contention, garbage collection pauses, allocation patterns, file and socket operations, thread activity. Mission Control is the tool that turns that file into something a person can read, and the README lists the two application features that matter most, a tool for visualizing the contents of Java flight recordings and the results of an automated analysis of those contents, plus a JMX console and a tool for heap waste analysis.
The automated analysis is the part that separates Mission Control from a viewer. A set of rules is run over the events, each rule producing a score, and the rules that fire are the findings. A human opening a recording with thousands of events wants to be told that there was lock contention on a particular monitor, not to go looking for it.
There is also a distribution channel worth knowing about, because it changes how you get the tool. Builds of Mission Control are found in the Oracle JDK on supported platforms and in the Eclipse Marketplace, and the project page is on oracle.com. The openjdk repository is the source of that, and the binary distributions come from downstream vendors.
Where a binary actually comes from
The README is clear that binary distributions of JDK Mission Control are provided by different downstream vendors, and it lists them. This is a distribution model worth understanding before you plan a rollout, because your choice of vendor determines your update schedule and your patching story.
Eclipse Adoptium offers a released version, early access builds of the upcoming release, and a downloadable Eclipse update site archive. Azul provides Zulu Mission Control, a released version only. Bell-Soft provides Liberica Mission Control, also a released version. Oracle distributes it as a released version with an integrated in-app update site and an Eclipse update site.
Red Hat is the most interesting case because it is the only one on the list that describes distribution through an operating system rather than as a standalone download. Red Hat distributes JDK Mission Control in Red Hat Enterprise Linux, available in RHEL 7 as the rh-jmc Software Collection and provided in RHEL 8 by the jmc:rhel8 module stream, and it is also included in the Red Hat OpenJDK developer builds for Windows.
That RHEL 8 module stream detail is a good example of why the vendor list matters. A module stream is a versioned, independently updatable component in the operating system, so on RHEL 8 the JMC version is tied to the operating system's lifecycle rather than to a download you remember to do. On RHEL 7 it is a software collection, the older mechanism for the same idea. Either way, the practical effect is that on a Red Hat estate the tool arrives through the normal patching path.
So the choice is between a vendor download that you manage and an operating system channel that manages it for you. For a team with a Red Hat footprint, the module stream is the answer that requires the least attention.
The application: workbench, JMX console and heap waste
The application side of the project is described as a framework for hosting various useful Java tools, which is a useful way to think about it. Mission Control is not one screen, it is a container that a set of tools plug into, and the plug-in point is why the JMX console and the heap analysis tool can live in the same application as the flight recording browser.
The JMX console is the piece that connects to a live JVM through the Java Management Extensions, which is the standard remote management interface for the platform. It is the part you use when the question is about the current state of a running process rather than about a recording you already have. If your deployment exposes JMX, the console gives you the same view of the live process that a monitoring agent would collect.
The heap waste analysis tool is the other application feature, and its subject is not the whole heap but the waste in it. In a long running Java service the interesting question is often not how much heap is used but how much of it is being held by objects the application no longer needs, and a dedicated tool for that is a different job from a memory graph or a heap dump analyser.
The framework description also explains a structural fact: the application is a host, and the tools are the content. That is why the same repository contains both a workbench and a headless API, and why the second half is more interesting for automation. The application is for a person looking at a recording; the core API is for a program doing the same analysis without a display.
The core API, its version floor and headless analysis
The core API carries the substance of the project for anyone who wants the analysis in a pipeline rather than in a window. The README lists its capabilities: core APIs for parsing and processing Java flight recordings, a framework for handling units of measurement and physical quantities, and support for headless analysis of Java flight recordings.
Two version facts are stated and both matter. The core API can read recordings from JDK 7 and above, and it can run on JDK 8 and above. The first is about the data format, since flight recording files from older JVMs differ from modern ones, and the second is about the runtime you need in order to execute the analysis. A service on JDK 8 can therefore analyse a recording captured on JDK 7, which is the situation most production estates are in when an incident spans an upgrade.
The units and physical quantities framework is a smaller feature with a large effect on how the output reads. A duration in a recording is not a bare number, it is a quantity with a unit, and the API models that. The example in the README computes a standard deviation over monitor enter events and prints it through a display helper rather than as a raw figure, which is how a duration comes out as something a person can read instead of nanoseconds.
Headless analysis is what makes the API usable in an automated workflow. A recording can be dropped into a directory, a process can pick it up, run the rules, and report the findings, with no display server and no human in the loop. The rest of the section is a set of Java examples showing exactly that, and the first one is the simplest possible version of it.
An HTML report from a recording, on the command line
The first Core API example is the one to try first, because it needs no code at all. It produces an HTML report from the command line:
java -cp <the built core jars> org.openjdk.jmc.flightrecorder.rules.report.html.JfrHtmlRulesReport <file> [<outputfile>]The class name says what it does. The rules are evaluated against the events in the recording file, and the results are written as an HTML report, with the output file optional. The classpath is the built core jars, which is the detail that makes this a developer-facing command rather than an end-user one: the tool is a library first, and the HTML report is one entry point into it.
That entry point is worth more than it looks. A report file is something you can attach to a ticket, publish to an internal wiki, or diff between two runs, without giving anybody a Mission Control installation. For an organisation that wants the analysis but not the desktop application, this command is the whole product.
The next example shows the same idea one level down, by using the API directly to compute an aggregate. The class loads the events from a file and then applies a filter before aggregating:
public class LoadRecording {
    public static void main(String[] args) throws Exception {
        IItemCollection events = JfrLoaderToolkit.loadEvents(new File(args[0]));
        IQuantity aggregate = events.apply(ItemFilters.type(JdkTypeIDs.MONITOR_ENTER))
                .getAggregate(Aggregators.stddev(JfrAttributes.DURATION));

        System.out.println("The standard deviation for the Java monitor enter events was "
                + aggregate.displayUsing(IDisplayable.AUTO));
    }
}
Three parts of that are worth noting. The events come back as an IItemCollection, which is the abstraction the whole API is built on. The filter selects a single event type, JdkTypeIDs.MONITOR_ENTER, which is the monitor contention event, and the aggregate is a standard deviation over the duration attribute. And the result is an IQuantity rather than a double, which is the units framework in action, printed through IDisplayable.AUTO so the value is rendered in a sensible unit.
Running the rules yourself, sequentially or in parallel
The third and fourth examples move from one aggregate to the whole rule set, which is the mechanism behind the automated analysis in the application.
The simple version iterates over the rules the registry provides, evaluates each one against the loaded events, and prints the ones that score above a threshold:
        for (IRule rule : RuleRegistry.getRules()) {
            RunnableFuture<Result> future = rule.evaluate(events, IPreferenceValueProvider.DEFAULT_VALUES);
            future.run();
            Result result = future.get();
            if (result.getScore() > 50) {
                System.out.println(String.format("[Score: %3.0f] Rule ID: %s, Rule name: %s, Short description: %s",
                        result.getScore(), result.getRule().getId(), result.getRule().getName(),
                        result.getShortDescription()));
            }
        }
Two design details are visible in those lines. A rule evaluation returns a RunnableFuture rather than a result, so the evaluation can be driven, scheduled or run concurrently, and the preference values are supplied explicitly, which is how the same rule can be evaluated with different thresholds in different contexts. The score is what decides whether a finding is reported, and the formatted output prints the score, the rule identifier, the rule name and a short description, so a report line is self-describing.
The parallel example does the same work across a thread pool sized from the number of available processors, and then sorts the results by descending score so the important findings come first. It also adds a usage message, and a second argument that limits the report to rules scoring at or above a given value.
For an engineering team, this is the part that changes the tool from a desktop application into a component. A rule is a class in the registry, evaluation is a future, and the output is a list of scored results, so writing your own rule or reordering the output is a normal programming task rather than a configuration exercise.
The repository layout and the licence question
The source tree at the root of the repository shows the split between the application and the library. The application directory holds the workbench and its tools, the core directory holds the APIs the examples above use, and the agent directory holds the component that connects to a live JVM. The configuration directory holds the plug-in and tool configuration, releng holds the release engineering setup, and there are directories for docker, docs, scripts, license and a pom.xml at the root for the Maven build. There are also build.sh and build.bat for building on Unix and Windows.
The presence of an agent directory is a signal about the architecture. Connecting to a running JVM is a separate component from analysing a recording, which is the right split for a tool that has to work in production environments where attaching to the process is intrusive.
The licence deserves a note. The repository's licence field is recorded as unknown, and the README does not state a licence, while a license directory sits at the root of the tree. For a project hosted under the openjdk organisation this is not a sign of an unusual licence but a sign of a different convention: the OpenJDK projects carry their licensing in a dedicated directory and in the form used by the wider OpenJDK community, and GitHub's classifier does not recognise it. Anyone who needs to know the terms, and especially anyone shipping Mission Control inside a product, should read the files in that directory rather than infer from the metadata.
On maintenance, the repository is not archived and the last push was on 2026-10-16, and there are no GitHub releases attached, so the build you use comes from a vendor rather than from a tag in this repository. There is an AGENTS.md and a CONTRIBUTING.md at the root, a.jcheck directory, and a topics list that includes Hacktoberfest 2025, which points to how the project recruits contributions.
Editorial conclusion
Adopt JDK Mission Control when you need to understand a running Java process beyond what a log tells you, and when you can point it at a Java flight recording rather than attaching to a live JVM, because the headless core API is the part that fits into a pipeline. It is the wrong tool if you need a single binary from this repository, since none is published here, and it is the wrong tool if your target JVM is older than JDK 7, since the core API can only read recordings from JDK 7 and above. Before adopting, decide which vendor build you will use and whether it is updated on your schedule, and check the licence file in the repository rather than relying on the licence field, which is recorded as unknown.
Frequently asked questions
What is JDK Mission Control used for?
It is an open source production time profiling and diagnostics tool for Java. It visualises Java flight recordings and the results of an automated analysis of them, provides a JMX console for live processes, and includes a heap waste analysis tool.
Where can I download JDK Mission Control?
Binary distributions come from downstream vendors rather than from this repository. The README lists Eclipse Adoptium with released and early access builds, Azul Zulu Mission Control, Bell-Soft Liberica Mission Control, Oracle, and Red Hat, which ships it in RHEL 7 as the rh-jmc Software Collection and in RHEL 8 as the jmc:rhel8 module stream.
Can I run Mission Control analysis without a GUI?
Yes. The core API supports headless analysis, and the README gives a command that produces an HTML report from a recording file: java -cp <the built core jars> org.openjdk.jmc.flightrecorder.rules.report.html.JfrHtmlRulesReport <file> [<outputfile>].
Which Java versions does the Mission Control core API support?
The core API can read recordings from JDK 7 and above, and it can run on JDK 8 and above. Both floors are stated in the README.
How do the automated rules work?
Each rule evaluates the loaded events and returns a RunnableFuture producing a Result with a score. The examples evaluate every rule in the registry, print the ones scoring above a threshold, and one example runs the evaluations in parallel and sorts the results by descending score.
Official sources
Add this badge to your README
If you maintain this project, the badge below links readers to this analysis and shows its maintenance status from the daily GitHub snapshot. Paste the markdown into your README; add ?metric=license or ?metric=stars to the image URL for a different field.

[](https://hysenlabs.com/projects/openjdk-jmc)Star history chart for your README
[](https://hysenlabs.com/projects/openjdk-jmc)Was this useful?