probe-rs pins its minimum Rust version in two files, and cargo-embed is slated to be phased out
A debugging toolset and library for debugging embedded ARM and RISC-V targets on a separate host
At a glance
- What is it?
- A Rust workspace of fourteen crates wrapping debug probes for embedded ARM, RISC-V and Xtensa targets, with a tool suite where one tool is recommended over another that is on its way out. Its workspace manifest carries a comment warning that the minimum Rust version is duplicated in the task runner, and it declares shared versioning while three of its crates sit on older version lines.
- Who is it for?
- probe-rs suits someone debugging bare-metal firmware who wants one tool across probe vendors and three core architectures, and who is willing to configure a Cargo runner rather than reach for a vendor tool. Before adopting it, check five things.
- Can I use it commercially?
- Yes. Apache-2.0 is a permissive licence: you can use, modify and sell software built on it, as long as you keep its copyright and licence notices.
- Is it still maintained?
- Yes. The repository last received commits 3 days ago.
- What is it written in?
- Mainly Rust, according to GitHub's language statistics.
Answers come from the project's GitHub data, last synced on November 19, 2026, and from our analysis. They are not legal advice.
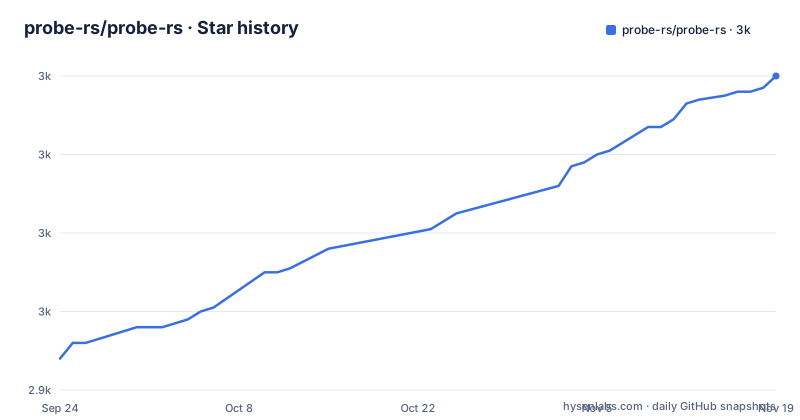
Star history
- probe-rs/probe-rs3,020 ★ · +72
| Repository | 2026-09-24 | 2026-11-19 |
|---|---|---|
| probe-rs/probe-rs | 2.9k | 3k |
72 Stars in the last 56 days, measured from the daily GitHub snapshot. Compare with other projects
Editorial analysis
cargo-embed is on its way out and the docs say which to prefer
The tools section answers a question most projects of this shape leave open, asking which tool you should use and answering it directly. For most projects the recommendation is the standalone runner, which flashes the firmware, resets the target, and streams runtime output and panic messages back to the console, which is what makes it work as a Cargo runner.
Then it names the two narrower tools and says what each is for. One offers similar functionality with an interactive runtime terminal on top. The other just flashes a binary onto the target with nothing further, for when programming the chip is the whole job.
The middle one carries a deprecation notice: it is expected to be phased out in the future, and new setups are pointed at the runner instead. That is worth pausing on, because the tool being retired is the one with the more capable terminal, and the tool replacing it is the simpler one.
So the guidance is to move from the tool with more features to the tool with fewer, on the grounds that the runner is the better default. Nobody is told what happens to existing configurations that depend on the interactive terminal, and the documentation does not give a target version for the removal.
The runner's cost is that it needs a Cargo configuration entry, which is where the next section's gap appears.
The Cargo runner example only covers bare-metal ARM
Wiring the runner into Cargo takes a target-specific runner setting, and the example is four lines long:
# .cargo/config.toml
[target.'cfg(all(target_arch = "arm", target_os = "none"))']
runner = "probe-rs run --chip nRF52840_xxAA"
The selector is the interesting part. It is a conditional configuration block matching bare-metal ARM targets, so the runner applies to that architecture and operating system combination and nothing else.
The project supports three core architectures. Following the example literally gives you a runner configured for one of them, and a RISC-V or Xtensa build would need its own entry. That is a gap in the example rather than in the tool, since the configuration format allows more than one block, but a reader copying the block will not get a working setup for the other two.
The chip is also hardcoded in the example, as a specific part from one vendor. Every project using the runner needs its own part name substituted, and nothing in the example says where to find the list of supported parts.
After that, running the project flashes and runs the firmware. So the whole setup is a selector, a part name, and one line pointing at the runner, which is a short path to a working setup for the one architecture the example covers.
The library examples show the same nesting the tools sit on top of: a probe, a session and a core, obtained in that order, with a permission set passed when attaching and a core index to select which one. A second example takes a different route, configuring a wire protocol and a speed explicitly and then attaching without naming a probe, which is the shorter path when there is only one target attached. That example builds a fifty-word buffer of thirty-two-bit values and starts a read from a fixed address, and the listing ends partway through the address.
The minimum Rust version is written twice, with a comment asking you to sync them
The workspace manifest declares a minimum Rust version, and immediately above that line there is a comment instructing that if the number is increased, the checked minimum in the task runner must be updated too.
The task runner does contain it. There is a target whose command pins the toolchain to a specific version and runs a check with all features enabled, and the version in that command matches the one in the manifest.
So the project has a real dependency it has documented as a hazard: a single number that must appear in two files, with no mechanism keeping them together. A contributor who raises the manifest and misses the task runner gets a check that still runs against the old toolchain, and the check passes, which is the worst outcome for a compatibility floor.
The task runner's default target is itself a short list of the project's gates. It runs a check, a formatting check, the linter, and the tests. The check step is three commands rather than one, covering the default feature set, no default features, and all features, so a crate with feature-gated code is verified at both extremes.
The tests run through a separate runner rather than the built-in one. Formatting has both a write form and a check form, with the default target using the check form so a plain invocation cannot rewrite files.
Shared versioning is declared, and three crates are on older version lines
The workspace declares shared versioning in its release metadata, alongside a tag template that wraps the version in a leading letter. That is the setting that makes a release bump every crate at once.
The dependency table then shows three crates that are not on that version. The memory interface crate is at zero point two, and the two remote-procedure-call crates, both the server side and the client side, are at zero point one. Everything else in the workspace is at the same version as the workspace itself, which currently matches the newest release tag.
So the shared-version setting is not producing uniform numbers, and the two outliers are the newer interfaces: the memory interface abstraction and the remote procedure call layer that the Linux example's mention of remote-server use implies is a supported arrangement.
That has a practical consequence for anyone depending on the crates rather than the command line tool. The three version lines are independent, so pinning the core library does not pin them, and a dependency that pulls two of these crates needs two version constraints rather than one.
The workspace lists fourteen members and excludes one nested project by path. The excluded one sits inside the core crate's own test directory, which is the usual arrangement for a standalone example crate that should not inherit the workspace's feature set and settings.
On Linux the host itself can be the probe, and the tool refuses to guess which device
One of the longest examples in the documentation is about turning a Linux host into a debug probe, with a plugin crate that provides two backends for driving the debug protocol directly from the host's own pins.
The first backend bit-bangs the protocol over the GPIO character device interface. The second emulates it over an SPI bus, and the mechanism is described concretely: the two bus lines are tied together through a series resistor.
Probe selection uses a synthetic selector, and the documentation is precise about how it is read. The vendor and product portion is ignored entirely. The serial portion carries either the chip-and-pin map or the path to the SPI device, depending on the backend:
# bit-banged GPIO
probe-rs run --probe 0:0:gpiochip1,swclk=26,swdio=25,srst=38 ...

# spidev
probe-rs info --probe 0:0:/dev/spidev0.0
The safety decision is the part worth carrying away. Listing probes only exposes SPI devices that have been explicitly set up through a device-manager rule, and the stated reason is that the tool should not implicitly try every SPI device on the system. On a bus where the two lines are tied together through a resistor, guessing which device to drive is a way to damage hardware, so discovery is opt-in and the operator wires up the permission explicitly.
The crate's own documentation is pointed at for wiring diagrams, cross-compilation and remote-server use, so the physical setup is documented alongside the commands.
One directory at the root sits outside all of that. The core crate, the tools crate and the interfaces are all listed as workspace members, but one sibling directory carrying the same naming pattern is not in the members list, and neither is it in the dependency table. So it is built by something other than the workspace, or it is not built at all, and nothing in the manifest says which.
Two licences sit at the root, and the release notes are fragments in a directory
The repository root holds two licence files, one for each of a dual-licence pair, and the workspace manifest records the choice as either of the two. The repository's licence metadata names only one of them, which is the usual shorthand and a small inconsistency with the manifest's phrasing.
The change notes are handled in two places. A change log file at the root records what has shipped, and a separate directory holds the fragments for changes that have not been released yet.
So a change is written as its own file, accumulates in a directory until a release, and is then folded into the single change log file. That is a workflow where the pull request itself carries a fragment, which makes reviewing a change and reviewing its eventual change log entry two separate events.
The rest of the root describes a workspace being worked on by several people at once. There are editor configurations for three editors, a spell checker configuration for the source, a cross-compilation configuration, a licence and advisory auditing configuration, a distribution configuration, a task runner, a dependency-update configuration, and a pinned toolchain file.
One entry crosses ecosystems: a manifest for a package on the Node registry, named for the built-in targets, versioned at one, with a single author and a one-line description. So the table of supported chips is distributed through two package ecosystems, the Rust one and the Node one, from the same repository.
The readme asks paid feature work to go to one account
The frequently asked questions section ends with an entry whose heading is a sentence: if your company needs a particular feature and would pay for its development, reach out to a named account.
That is a paid engagement route stated in the readme rather than on a separate page, and it is the only place in the documentation where commercial work is solicited. No rate, no terms, no process and no response time are given, and the contact is an individual account rather than an address or a company.
The two entries above it are the support ones. For help, the project asks you to file an issue, use the chat channel, or email the same account, and points at a troubleshooting section on the project site. For helping, it asks you to look at the issues or open one, notes that contributions are welcome, and points at a contributing file.
So the same account is the route for a bug report, for a support question, for a paid feature, and for a commercial enquiry about the paid edition of a related project. That concentration is worth knowing about before relying on the support paths.
The build requirement is stated in the same section: Rust and Cargo, installed through the standard toolchain installer. There is no install command for the tools themselves anywhere in the readme.
Editorial conclusion
probe-rs suits someone debugging bare-metal firmware who wants one tool across probe vendors and three core architectures, and who is willing to configure a Cargo runner rather than reach for a vendor tool. Before adopting it, check five things. Decide between the recommended runner and the older embed tool, since the documentation says the latter is expected to be phased out. Read the target selector in any Cargo runner configuration you copy, because the example given is scoped to bare-metal ARM and does not cover the other architectures the project supports. Note that the README contains no install command and sends you to an external page, so plan for that extra step. Expect unreleased work to appear as fragments in a directory rather than as commits. And if you rely on the minimum Rust version, remember it is written in the manifest and again in the task runner, with a comment asking you to keep them in step.
Frequently asked questions
how to install probe rs
The README contains no install command. It says the recommended way is to download a precompiled version using the methods on the project's getting-started installation page, and that page is where the steps live. Building from source instead requires Rust and Cargo installed through the standard toolchain installer.
what is probe rs
A Rust library and toolset for debugging embedded ARM, RISC-V and Xtensa targets from a separate host. It talks to probes from several vendors over SWD or JTAG, reads and writes target memory, and drives halt, step, breakpoints and trace, and it can flash ELF, BIN and IHEX images using standard CMSIS-Pack algorithms.
Should I use cargo-embed or the probe-rs runner?
The runner. For most projects the documentation recommends probe-rs run, which flashes, resets and streams runtime output and panics back to the console. cargo-embed offers similar functionality with an interactive terminal and is expected to be phased out, so new setups are pointed at the runner.
Can probe-rs debug a board from the Linux host itself?
Yes, through a plugin crate providing two backends: one bit-bangs the protocol over the GPIO character device interface, and one emulates it over an SPI bus by tying the two bus lines together through a series resistor. Probe selection uses a synthetic selector whose serial portion carries the pin map or device path.
What license is probe-rs under?
Dual licensed. Two licence files sit at the repository root and the workspace manifest records the licence as either of the two, while the repository's licence metadata names only one of them.
How does probe-rs track unreleased changes?
As individual fragments in a changelog directory, separate from the change log file at the root that records what has shipped. A change is written as its own file and folded into the main change log at release.
Official sources
Add this badge to your README
If you maintain this project, the badge below links readers to this analysis and shows its maintenance status from the daily GitHub snapshot. Paste the markdown into your README; add ?metric=license or ?metric=stars to the image URL for a different field.

[](https://hysenlabs.com/projects/probe-rs-probe-rs)Star history chart for your README
[](https://hysenlabs.com/projects/probe-rs-probe-rs)Was this useful?