filprofiler: finding the line that allocated the memory
A Python memory profiler for data processing and scientific computing applications
At a glance
- What is it?
- Fil is a memory profiler for Python data processing, written with a Rust extension and PyO3 binding, that answers two questions: where peak memory was reached and which code allocated it.
- Who is it for?
- Fil fits a Python team running data processing or scientific workloads that hit an out of memory error or an unexpectedly large footprint, on Linux or macOS with CPython 3.9 or later, and it does not fit a team on Windows or on PyPy, which the build configuration explicitly excludes.
- Can I use it commercially?
- Yes. Apache-2.0 is a permissive licence: you can use, modify and sell software built on it, as long as you keep its copyright and licence notices.
- Is it still maintained?
- Activity is slowing. The repository last received commits 6 months ago.
- What is it written in?
- Mainly Rust, according to GitHub's language statistics.
Answers come from the project's GitHub data, last synced on November 6, 2026, and from our analysis. They are not legal advice.
Star history
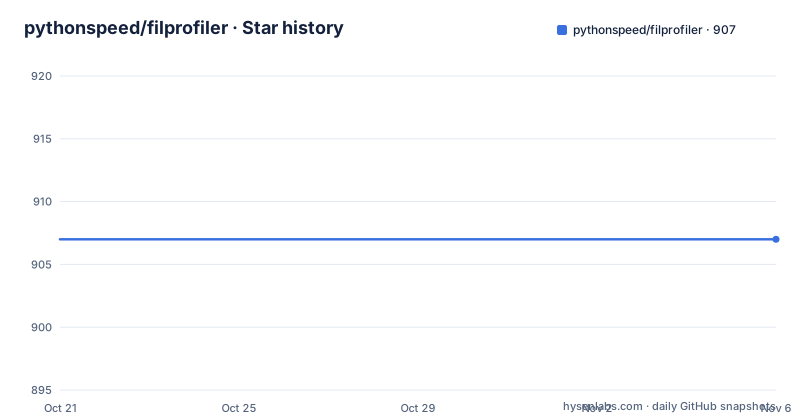
- pythonspeed/filprofiler907 ★ · +0
| Repository | 2026-10-21 | 2026-11-06 |
|---|---|---|
| pythonspeed/filprofiler | 907 | 907 |
0 Stars in the last 16 days, measured from the daily GitHub snapshot. Compare with other projects
Editorial analysis
Two questions: the high-water mark and the allocating code
Fil states its purpose as a set of questions rather than a feature list. Your Python code reads some data, processes it, and uses too much memory, maybe dying with an out of memory error. To reduce that usage you first need to know where peak memory usage is, the high-water mark, and what code was responsible for the memory that was present at that peak moment. That framing is the reason to care about the tool. Reporting how much memory a script used at the end tells you that something is wrong, and reporting the peak tells you how bad it got, but neither points at a line of code. A profiler that attributes the retained memory to the code that allocated it turns a number into a fix. The project page describes Fil as an open source memory profiler designed for data processing applications written in Python, and it also mentions native support for Jupyter, which is where data work usually happens.
A Rust extension bound to CPython through PyO3
The implementation is a hybrid, and the repository layout shows it. The primary language is Rust, and the Cargo workspace has exactly two members, memapi/ and filpreload/, while the Python side lives in filprofiler/. The binding is declared in setup.py as a RustExtension named filprofiler._filpreload, built from filpreload/Cargo.toml, with binding=Binding.PyO3 and debug=False. A second directory, filpreload/, also contains C sources, since the Makefile dependency line for the shared library lists filpreload/src/*.c alongside the Rust files. The release profile in Cargo.toml sets lto = true and carries a comment that debug symbols are needed for profiling and should be disabled for a real release, which tells you the tool depends on debug information being present in the binary it inspects. A profiler that reads allocation sites needs symbols, and this design arranges for them to be built in.
The fil-profile command and the Jupyter kernel it installs
The Python packaging metadata defines the entry point and the notebook integration. The console script is named fil-profile and points at filprofiler._script:stage_1, and the package ships its own data files into the Jupyter kernels directory:
setup(
    name="filprofiler",
    packages=["filprofiler"],
    entry_points={
        "console_scripts": ["fil-profile=filprofiler._script:stage_1"],
    }
The kernel payload comes from a directory named data_kernelspec, globbed and installed under share/jupyter/kernels/filprofile, so installing the package is what makes the kernel appear in a notebook front end. There is also a generate-kernelspec.py script at the repository root, which is how that kernel specification is produced rather than maintained by hand. The stage_1 naming in the entry point is worth noting for anyone scripting the tool, since it implies the command has more than one stage, and the shipped console script is the documented way to start a profiled run rather than an import inside your own code.
Building from a clone with pip and cargo
The Makefile at the repository root is the shortest route to a working build, and its build target does two things:
	pip install -e .
	python setup.py install_data
The first installs the package in editable mode, the second installs the data files, which is where the Jupyter kernel lands. The native library is built by cargo, and the Makefile names the rule explicitly:
cd filpreload && cargo build --releaseThere is also a venv target that creates a virtual environment and upgrades pip, setuptools and setuptools-rust in it, which is the sensible way to work through the Rust toolchain requirement without touching the system interpreter. The project depends on threadpoolctl at install time and declares python_requires >= 3.9, with classifiers listing Python 3.9 through 3.13 and CPython only. The documentation also states that Fil runs on Linux and macOS.
PyPy wheels are skipped on purpose, and wheels are built in manylinux
The build configuration explains why Fil cannot be a general purpose profiler. The cibuildwheel settings disable PyPy wheels with the comment that the project uses CPython internals, and 3.10 was skipped until it was ready, with skip = ["pp*"]. A profiler that hooks the allocator has to live inside the interpreter, and the internals it depends on are CPython internals. That is a hard boundary rather than a missing feature, and it is worth noting before a team plans to run its workload on PyPy for speed. For the supported platforms, wheels are produced in a manylinux container, and the Makefile target shows the exact image and command:
python setup.py bdist_wheel docker run -v $(PWD):/src quay.io/pypa/manylinux_2_28_x86_64 /src/wheels/build-wheels.shRunning the build inside a manylinux container is what makes the resulting wheels installable on a wide range of Linux distributions, and the volume mount of the working tree is how the output gets back to the checkout.
The test suite compiles Cython, C++, C and Fortran fixtures
The Makefile test targets separate the Rust tests from the Python ones, and the Rust side runs with backtraces enabled:
	cd memapi && env RUST_BACKTRACE=1 cargo test
	cd filpreload && env RUST_BACKTRACE=1 cargo test --no-default-features
The Python side depends on the build, runs pytest over filprofiler/tests/, and lints with flake8. The dependency-free variant is where the interesting fixtures live, because the test scripts have to be compiled before they can be run. That target cythonizes a .pyx file in place, compiles a shared C++ library and a shared C library, and runs f2py against a Fortran source file, then executes the suite. A profiler that reports allocations has to survive programs that allocate from C, from C++, from Cython and from Fortran, and these fixtures exist precisely to exercise those allocation paths.
Apache-2.0 with bundled third-party licences, and a release trail that stops in 2024
Fil is distributed under the Apache License, Version 2.0, with the notice in the project page attributing copyright to Hyphenated Enterprises LLC, and the repository carries a LICENSE file alongside an extra-licenses/ directory. Third-party licence obligations are handled by a dedicated Makefile target that runs cargo lichking check and cargo lichking bundle to regenerate filprofiler/licenses.txt, and then appends extra-licenses/APSL.txt to it, so the redistribution obligations of the Rust dependencies travel with the wheel. The version scheme is date based, and the releases listed for the project are 2024.11.2 on 2024-11-04, 2024.10.1 and 2024.10.0 both on 2024-11-03. The last push to the repository was on 2026-05-03 and the repository is not archived, so work continues while the tagged releases sit well behind it. A team that pins the newest tag is pinning code from November 2024, and CHANGELOG.md, generated from the .changelog/ directory by towncrier, is where the difference between a tag and the current branch will be described.
Editorial conclusion
Fil fits a Python team running data processing or scientific workloads that hit an out of memory error or an unexpectedly large footprint, on Linux or macOS with CPython 3.9 or later, and it does not fit a team on Windows or on PyPy, which the build configuration explicitly excludes. Verify three things before you adopt it: that your interpreter and platform are in the supported set, that the release you install matches the work in the repository, since the tagged releases stop at 2024.11.2 from 2024-11-04 while the last push was on 2026-05-03, and that the fil-profile command and the filprofile Jupyter kernel install cleanly on the machines that will run the profiled job.
Frequently asked questions
What platforms and Python versions does filprofiler support?
The documentation states that Fil runs on Linux and macOS and supports CPython 3.9 and later, with classifiers listing Python 3.9 through 3.13.
Why are there no PyPy wheels for filprofiler?
The build configuration disables PyPy wheels because the project uses CPython internals, and the skip setting is pp* in the cibuildwheel configuration.
How do you run a memory profile with filprofiler?
The package installs a console script named fil-profile, and the packaging metadata also installs a Jupyter kernel named filprofile from the data_kernelspec directory, so profiling is available from a terminal or from a notebook.
What licence is filprofiler released under?
Fil is distributed under the Apache License, Version 2.0, and the project page attributes copyright to Hyphenated Enterprises LLC.
Official sources
Add this badge to your README
If you maintain this project, the badge below links readers to this analysis and shows its maintenance status from the daily GitHub snapshot. Paste the markdown into your README; add ?metric=license or ?metric=stars to the image URL for a different field.

[](https://hysenlabs.com/projects/pythonspeed-filprofiler)Star history chart for your README
[](https://hysenlabs.com/projects/pythonspeed-filprofiler)Was this useful?