LayerChart for composable Svelte visualizations
Composable Svelte chart components to build a large variety of visualizations
At a glance
- What is it?
- LayerChart is a TypeScript library of composable Svelte components for Cartesian, radial, hierarchical, graph, geographic, and calendar visualizations. It suits Svelte teams that want reusable chart building blocks, but its README does not document consumer installation or a first-chart example.
- Who is it for?
- LayerChart is a reasonable candidate for a Svelte application that needs several visualization types assembled from reusable components, especially when the team is comfortable with TypeScript and pnpm workspaces. It is a weaker choice for a developer seeking documented one-command consumer installation, a complete first-chart tutorial, or evidence of direct D3 API parity.
- Can I use it commercially?
- Yes. MIT is a permissive licence: you can use, modify and sell software built on it, as long as you keep its copyright and licence notices.
- Is it still maintained?
- Yes. The repository last received commits 4 days ago.
- What is it written in?
- Mainly TypeScript, according to GitHub's language statistics.
Answers come from the project's GitHub data, last synced on November 6, 2026, and from our analysis. They are not legal advice.
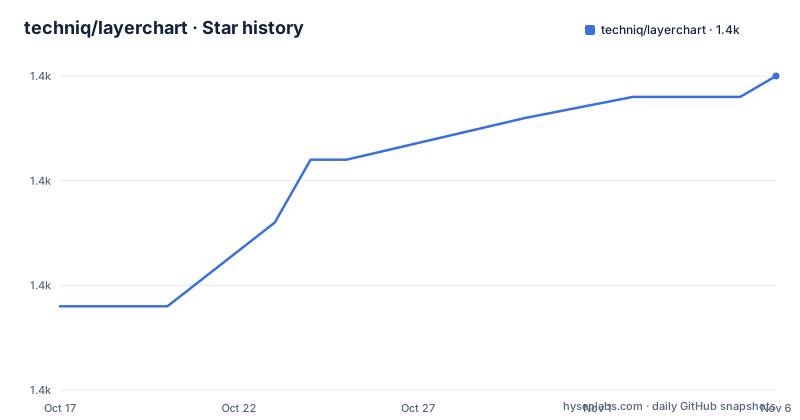
Star history
- techniq/layerchart1,370 ★ · +11
| Repository | 2026-10-17 | 2026-11-06 |
|---|---|---|
| techniq/layerchart | 1.4k | 1.4k |
11 Stars in the last 20 days, measured from the daily GitHub snapshot. Compare with other projects
Editorial analysis
LayerChart's component scope for Svelte applications
LayerChart addresses developers who need to construct several kinds of visualizations inside Svelte applications. Instead of presenting one fixed chart configuration, the README describes the library as a collection of composable chart components. That makes it relevant to dashboards, analytical interfaces, and other screens where a bar chart may sit beside a radial chart, geographic view, or relationship diagram.
The documented chart families are unusually broad. Cartesian components cover Area, Bar, Line, and Scatter. Radial and polar choices include Arc, Area, Bar, Line, Radar, and Pie. Hierarchical components include Pack, Partition, Tree, and Treemap. The project also lists Dagre, Force, and Sankey under graph visualizations; Choropleth, Spike, Bubble, Point, and Globe under geo; and Calendar as its own category.
That breadth is the project's main distinction, not proof that every chart has identical configuration or behavior. The README does not publish component props, data contracts, accessibility guarantees, server-rendering instructions, or browser support. Those omissions matter during evaluation because the category list establishes intended coverage, while it does not establish how deeply each component is developed. The TypeScript language and the d3 topic connect the project to typed visualization code and D3, but the README does not explain which D3 APIs are exposed.
LayerChart's monorepo structure and change flow
Based on the repository layout, LayerChart is developed as a pnpm workspace rather than as a single visible source directory. The root contains `packages/`, `docs/`, `examples/`, and a bundle-analysis package. Example workspaces include standalone and UI-framework examples such as `daisyui-5/`, `shadcn-svelte-1/`, and several `skeleton` variants. The root `package.json` is named `layerchart-monorepo`, uses ES modules, and declares `[email protected]` as its package manager.
The root development script packages the `layerchart` workspace and starts development servers for that package and the documentation site in parallel. This indicates that packaging the library and running its local surfaces are separate operations joined by a root command. For focused package work, the README directs contributors into `packages/layerchart` and starts `pnpm dev` there.
Changes use Changesets. A contributor runs `pnpm changeset` to add a changeset, which the repository associates with its changelog and next version. Root scripts also expose `changeset:version` and `changeset:release`. This supports a reviewable release path, although the README does not say whether every pull request must include a changeset or how migration notes are written. The recent package releases named `[email protected]`, `[email protected]`, and `[email protected]` show that versioning and package publication are real workflow elements rather than a purely descriptive library.
Running LayerChart from the repository for a first local use
The README provides contributor setup instructions, not an application-facing installation guide. A first documented use therefore means running the package development environment and associated documentation surface. These commands are copied from the repository workflow.
Install the monorepo dependencies from the repository root:
pnpm iThen start the focused `layerchart` package development server:
cd packages/layerchart
pnpm dev
The resulting process should be the package's development server. The README does not state its port or describe the page shown in a browser, so neither can be supplied reliably.
For the broader local setup, return to the repository root and use the root script. It packages `layerchart`, then starts the package and docs development processes in parallel:
pnpm devThe repository includes several example workspaces, but the README does not give a command that starts a particular example, and it does not present a first chart component. Consumers are directed implicitly to the npm package through the README badges, while the homepage is `https://www.layerchart.com`. Before adopting LayerChart in a new Svelte project, confirm the current npm package setup and import syntax in the project's own documentation. Installing the monorepo with `pnpm i` is a contributor operation; it should not be presented as the application installation procedure.
Using LayerChart's chart families without assuming API parity
LayerChart's design appears to favor composition, but the README stops short of showing how components exchange data or configure scales, axes, legends, and interactions. It would be a mistake to assume that a Bar component accepts the same data shape as a Sankey component merely because both are exported from the same library. Their visual models differ substantially: Cartesian and radial charts can begin with conventional records, while hierarchical and graph components may require a different structure. The README does not state those records or transformations.
The listed Svelte UX companion is separate. It is described as a collection of components, actions, stores, and utilities for interactive applications. That gives it a different scope from LayerChart, whose listed purpose is chart construction. A team can therefore evaluate LayerChart for visualization components and Svelte UX for surrounding interaction infrastructure without treating the names as interchangeable packages.
The repository also exposes build and quality scripts at the root. These include unit tests across workspaces, package and example checks, linting, formatting, package builds, and example builds. They show the project's internal workflow, but no test results, coverage values, or supported-Svelte matrix are included. Before selecting a particular LayerChart component, an application team would need to inspect that component's documentation and example for props, slot or snippet behavior, data conversion, event handling, and accessibility semantics.
LayerChart and direct D3 implementation as different approaches
The repository identifies d3 as a topic, while LayerChart presents itself as Svelte components. For a project already built from low-level D3 visualization code, LayerChart offers a different composition approach: application developers can select named chart components rather than retain all scale, layout, and rendering assembly in their own Svelte integration. The README does not document whether LayerChart exposes D3 objects directly, preserves a specific D3 rendering model, or supports the same customization depth as direct D3 work.
That distinction creates a real trade-off. LayerChart can reduce the amount of reusable interface code an application writes when its required chart family is covered. Direct D3 work keeps more assembly under the application's control, but the project does not document the maintenance burden or feature coverage of that route. It would therefore be misleading to call either approach universally better. The practical question is whether the documented LayerChart component supports the required data and customization model.
For a single unusual visualization outside the listed families, a direct implementation may be the clearer path. For a product with several conventional charts, reviewing LayerChart's component examples may be more productive than recreating shared structure. The deciding evidence should come from the required component's API and output, neither of which appears in the README.
LayerChart maintenance, licensing, and adoption limits
The repository is not archived. Its last push was on 2026-10-13, and the release list includes `[email protected]` on 2026-10-13, `[email protected]` on 2026-10-12, and `[email protected]` on 2026-10-10. These dates and releases support an assessment of recent repository activity. They do not establish API stability across the 2.x line or show that upgrading is free of application changes.
The declared license is MIT in both the repository description and root `package.json`. For an engineering review, that means the project is presented under a permissive license with an explicit `LICENSE` file at the repository root. License acceptance, attribution, dependency obligations, and compatibility with organizational policy require review against the actual license text and the full dependency graph. The MIT label alone is not a legal sign-off.
The clearest limitations are documentation gaps and release frequency. Consumer installation, exact package imports, compatibility requirements, browser support, accessibility, server rendering, and a first chart are absent from the README. Recent version changes may also require adopters to read each release note before moving between 2.6.1, 2.7.0, and 2.8.0. The repository includes unit-test, check, lint, build, and bundle-analysis scripts, but it does not publish their results.
Editorial conclusion
LayerChart is a reasonable candidate for a Svelte application that needs several visualization types assembled from reusable components, especially when the team is comfortable with TypeScript and pnpm workspaces. It is a weaker choice for a developer seeking documented one-command consumer installation, a complete first-chart tutorial, or evidence of direct D3 API parity. Before adoption, verify package installation from npm, the API and accessibility behavior of the required chart components, Svelte compatibility, and whether the resulting client bundle fits the application. For this repository, the first concrete adoption check is a small Svelte chart containing the exact component and data shape needed by the product.
Frequently asked questions
How do I install LayerChart in a Svelte project?
The README does not give consumer installation commands or an import example. It shows `pnpm i` for installing repository dependencies for contributors, so that workflow should not be assumed to be the package setup for an application.
What kinds of charts can LayerChart build?
The README lists Cartesian, radial and polar, hierarchical, graph, geographic, and calendar components. Its examples include Bar and Line, Tree and Treemap, Dagre and Sankey, Choropleth and Globe, and Calendar.
How do I run LayerChart locally from its repository?
Run `pnpm i`, change into `packages/layerchart`, and run `pnpm dev`. The root `pnpm dev` script instead packages the library and starts the package and documentation development processes in parallel.
What license does LayerChart use?
The repository declares the MIT license and includes a `LICENSE` file at its root. The README does not describe additional licensing conditions.
Official sources
Add this badge to your README
If you maintain this project, the badge below links readers to this analysis and shows its maintenance status from the daily GitHub snapshot. Paste the markdown into your README; add ?metric=license or ?metric=stars to the image URL for a different field.

[](https://hysenlabs.com/projects/techniq-layerchart)Star history chart for your README
[](https://hysenlabs.com/projects/techniq-layerchart)Was this useful?