pprof-rs: Sampling CPU Profiles Inside Rust Programs
A Rust CPU profiler implemented with the help of backtrace-rs
At a glance
- What is it?
- pprof-rs is an embeddable Rust CPU profiler based on backtrace-rs, with optional flamegraph and pprof protobuf output. It fits applications that need in-process profiling, but its documented setup leaves platform and symbolization behavior worth checking before adoption.
- Who is it for?
- Adopt pprof-rs when a Rust service needs an in-process profiler and flamegraph or pprof-compatible output. Do not choose it if you need a documented cross-platform setup, allocation profiling, or a stable nightly unwinder.
- Can I use it commercially?
- Yes. Apache-2.0 is a permissive licence: you can use, modify and sell software built on it, as long as you keep its copyright and licence notices.
- Is it still maintained?
- Yes. The repository last received commits 55 days ago.
- What is it written in?
- Mainly Rust, according to GitHub's language statistics.
Answers come from the project's GitHub data, last synced on November 7, 2026, and from our analysis. They are not legal advice.
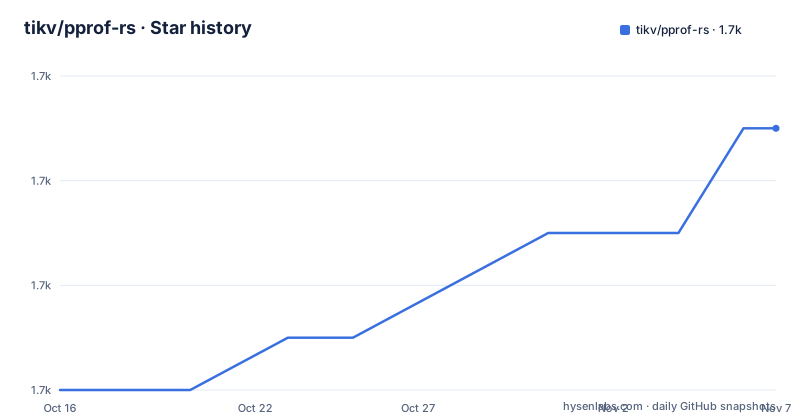
Star history
- tikv/pprof-rs1,661 ★ · +5
| Repository | 2026-10-16 | 2026-11-07 |
|---|---|---|
| tikv/pprof-rs | 1.7k | 1.7k |
5 Stars in the last 22 days, measured from the daily GitHub snapshot. Compare with other projects
Editorial analysis
Why pprof-rs belongs inside a Rust process
pprof-rs addresses CPU profiling for a running Rust program rather than treating profiling as a separate deployment system. The intended users are developers who need stack samples from their own process and want to inspect them through Rust APIs. That makes the crate relevant to long-running services, command-line workloads, and test programs where an external profiler would add another installation or integration path.
The project produces a `Report` from an active `ProfilerGuard`. According to the README, that report has a human-readable `Debug` representation containing frames and thread names. With additional Cargo features, the same collection can produce an SVG flamegraph or a pprof protobuf profile. This gives the profiler several output paths without requiring the application to adopt a separate reporting library for each format.
The scope is CPU stack profiling. The documented features concern demangling, stack acquisition, report encoding, flamegraph rendering, and frame post-processing. They do not describe heap allocation tracking, lock contention metrics, event tracing, or continuous system-wide monitoring. An application seeking wall-clock latency analysis or memory behavior should not assume that a CPU profile answers those questions.
The crate is also narrowly tied to profiling while the guard is alive. The README states that profiling continues until the guard is dropped. A program that cannot keep a guard in scope for its measured workload will therefore have little sample data to report.
Guard, sampled frames, and report construction
The visible control flow starts with `ProfilerGuardBuilder`, which configures sampling and builds a guard. The README's basic example sets a frequency of `1000` and supplies a blocklist containing `libc`, `libgcc`, `pthread`, and `vdso`. During the guard's lifetime, the program calls `guard.report().build()` to assemble a `Report`.
The sample output shows stack frames followed by a thread name and a numeric count. Its call stacks include application frames from `prime_number`, Rust standard-library frames, native runtime frames, and unknown frames. This is consistent with a Rust profiler built with `backtrace-rs`, but the README does not document every platform-specific sampling or unwinding path. In particular, engineers should not infer identical frame coverage on Linux, macOS, and Windows from the single example.
The crate exposes an optional `frame-pointer` feature, described by the README as available only for nightly Rust. `Cargo.toml` also lists `framehop-unwinder`, `perfmaps`, `large-depth`, and `huge-depth` features, but the README does not explain their operational behavior or platform requirements. Their presence confirms that unwinder depth and implementation choices are configurable, but it is not enough to state that any particular feature works everywhere.
Reports can be created more than once while a guard remains active, based on the documented call to `guard.report().build()`. The repository contains examples named for multithreaded collection and profiling while backtracing are active, which indicates that thread and timing behavior receive project-level attention. The README does not state the memory ceiling, maximum supported thread count, or exact behavior when stack capture fails.
Installing pprof-rs and generating the first report
The README points users to the `pprof` crate on Crates.io and documents version `0.15` for flamegraph configuration. `Cargo.toml` identifies the package as `pprof`, version `0.15.0`, with Rust edition `2021` and minimum supported Rust version `1.74.0`. Add the basic dependency to an application's `Cargo.toml`:
[dependencies]
After dependencies resolve, create a guard around the workload that should be profiled. This README example requests `1000` samples per frequency unit as configured by the builder and excludes four listed libraries:
let guard = pprof::ProfilerGuardBuilder::default().frequency(1000).blocklist(&["libc", "libgcc", "pthread", "vdso"]).build().unwrap();Run the workload while that variable remains in scope, then request a report:
if let Ok(report) = guard.report().build() {
    println!("report: {:?}", &report);
};
The `Result` means report construction can fail. A real application should handle that error rather than treating the `if let Ok(...)` example as proof that sampling always succeeds. The README does not publish a standalone CLI installation command, platform prerequisites, or a complete executable example for basic use.
Flamegraph output and Cargo feature selection
SVG flamegraphs are optional rather than part of the default feature set. Enable `flamegraph` to make `Report::flamegraph` available, and configure the dependency as shown in the README:
pprof = { version = "0.15", features = ["flamegraph"] }After collecting the report, write its flamegraph to a file:
if let Ok(report) = guard.report().build() {
    let file = File::create("flamegraph.svg").unwrap();
    report.flamegraph(file).unwrap();
};
The default feature list in `Cargo.toml` contains `cpp`, which enables C++ symbol demangling through `symbolic-demangle/cpp`. The README separately describes `cpp`, `flamegraph`, `prost-codec`, `protobuf-codec`, and `frame-pointer`. These features should be selected for concrete output requirements rather than enabled without a reason. They pull in different report, rendering, or unwinding dependencies.
For image sizing, the project exposes `Options` and `flamegraph_with_options`:
if let Ok(report) = guard.report().build() {
    let file = File::create("flamegraph.svg").unwrap();
    let mut options = pprof::flamegraph::Options::default();
    options.image_width = Some(2500);
    report.flamegraph_with_options(file, &mut options).unwrap();
};
This changes rendering configuration, not collection frequency. The README does not document SVG size limits, streaming behavior, or whether large sample sets require additional memory.
pprof protobuf profiles and external viewing
For compatibility with Google's pprof tooling, the README documents protobuf output based on `profile.proto`. Two Cargo features implement this through different Rust ecosystems. `prost-codec` uses `prost`, while `protobuf-codec` uses the `protobuf` crate. Both enable the private `_protobuf` feature in `Cargo.toml`, but the project presents them as alternative codec paths rather than documenting that both must be enabled.
The repository includes separate examples named `profile_proto_with_prost.rs` and `profile_proto_with_protobuf_codec.rs`. That layout makes the choice explicit at the example level. The README's encoding example starts by building a report, converting it with `report.pprof()`, encoding the profile into a byte buffer, and writing it to `profile.pb`:
match guard.report().build() {
    Ok(report) => {
        let mut file = File::create("profile.pb").unwrap();
        let profile = report.pprof().unwrap();

        let mut content = Vec::new();
        profile.encode(&mut content).unwrap();
        file.write_all(&content).unwrap();

        println!("report: {}", &report);
    }
    Err(_) => {}
};
The README then gives this command for generating an SVG through the separately installed `pprof` command:
~/go/bin/pprof -svg profile.pbThat command is not provided by pprof-rs itself. The library writes the protobuf file, while the external tool renders it. The repository has no documented releases, so dependency upgrades are not tracked through the GitHub release history.
Frame post-processing, demangling, and diagnostic limits
Raw statistics can be transformed before a report is generated through `frames_post_processor`. The documented use case is grouping or renaming symbols and threads before visualization. The documented example applies regular expressions to names such as `grpc-server-*`, several `raftstore` variants, RocksDB thread names, sender threads, apply threads, and `future-poller-*`. Those examples appear tailored to TiKV-style workloads, but the mechanism is not limited to those names.
A processor is installed on the report builder:
if let Ok(report) = guard.frames_post_processor(frames_post_processor()).report().build() {
    let file = File::create("flamegraph.svg").unwrap();
    report.flamegraph(file).unwrap();
}
This is useful when numbered worker threads would fragment a flamegraph or when recognizable categories matter more than exact runtime thread names. It also introduces a correctness concern: an overly broad regular expression can merge distinct execution contexts and make a report easier to read but less diagnostic. The README does not define validation rules for processors or recovery behavior after one mutates `Frames`.
Unknown symbols remain visible in the sample output, and `cpp` is an optional demangling feature. Stripped binaries, unavailable symbols, or unsupported frames can therefore limit interpretation. The documentation does not claim universal symbolization or provide a platform support matrix. That silence matters more than the convenient report API: an engineer needs to know whether frames are useful in the exact release build being profiled.
Maintenance, licensing, and adoption trade-offs
The repository is not archived, and its last push was on 2026-09-14. That is the available evidence of recent repository activity; the project has no GitHub releases, so there is no release cadence to report from repository release metadata. Upgrade planning should account for the absence of published GitHub releases and inspect `CHANGELOG.md` and `Cargo.toml` when changing versions.
The package declares `Apache-2.0` in `Cargo.toml` and includes a `LICENSE` file. The crate's declared license identifies the terms associated with use and distribution, but application owners remain responsible for checking how that license interacts with their own code and dependencies. The README does not provide legal guidance.
A real alternative is an external sampling profiler that attaches to a running process and writes its own format. Its approach differs from pprof-rs: it keeps collection outside the application and adds process-attachment or platform tooling, while pprof-rs embeds the guard and report pipeline directly in Rust code. Another alternative is building reports through the `pprof` command after pprof-rs exports protobuf, but that is complementary rather than a substitute collector.
pprof-rs is the wrong choice when a project requires nightly Rust solely for `frame-pointer`, cannot embed a profiling guard, or needs documented metrics outside CPU stack sampling. The absence of a documented platform matrix, cost measurements, and rollback guidance also means a production decision should start with a representative release build rather than the README's `prime_number` output alone.
Editorial conclusion
Adopt pprof-rs when a Rust service needs an in-process profiler and flamegraph or pprof-compatible output. Do not choose it if you need a documented cross-platform setup, allocation profiling, or a stable nightly unwinder. Verify the intended platform, symbolized frames, profiler overhead, and required Cargo features in a representative build before deployment; pprof-rs 0.15.0 requires Rust 1.74.0, and frame-pointer profiling is documented as nightly-only.
Frequently asked questions
How do I install and use pprof-rs in a Rust application?
Add `pprof = "0.15"` under `[dependencies]`, create a `ProfilerGuardBuilder`, and keep its guard in scope while the workload runs. Build a report with `guard.report().build()`. The package declares Rust `1.74.0` as its minimum supported version.
How does pprof-rs generate a flamegraph?
Enable the `flamegraph` Cargo feature, build a `Report`, create an output file, and call `report.flamegraph(file)`. The README also documents `flamegraph_with_options` for settings such as `image_width`.
Can pprof-rs export a profile for the pprof command?
Yes. With a protobuf codec enabled, the report can be converted with `report.pprof()` and encoded to a file. The README documents opening that file with `~/go/bin/pprof -svg profile.pb`.
Does pprof-rs support frame-pointer stack capture?
The README lists `frame-pointer` as a feature, but states that it is available only for nightly Rust. The default configuration does not require nightly Rust, while the package's minimum supported Rust version is `1.74.0`.
Official sources
Add this badge to your README
If you maintain this project, the badge below links readers to this analysis and shows its maintenance status from the daily GitHub snapshot. Paste the markdown into your README; add ?metric=license or ?metric=stars to the image URL for a different field.

[](https://hysenlabs.com/projects/tikv-pprof-rs)Star history chart for your README
[](https://hysenlabs.com/projects/tikv-pprof-rs)Was this useful?