CodeLLDB is a debug adapter that hands VS Code everything LLDB already knew how to do
A VSCode debugger extension for native code, powered by LLDB.
At a glance
- What is it?
- vadimcn/codelldb wraps LLDB as a VS Code debug adapter rather than reimplementing a debugger. That decision shows up in the feature list, in the platform floors, and in two places where the build still carries a Rust workspace and a Python configuration pointing into a build directory.
- Who is it for?
- CodeLLDB is the right pick for C++ and Rust work in VS Code, and a reasonable one for Ada, Fortran, Kotlin Native, Nim, Objective-C, Pascal, Swift and Zig where the compiler emits compatible debugging information. Before installing, check your host against the version floors, since Windows is x86_64 only and Apple Silicon macOS needs 11.0 or newer.
- Can I use it commercially?
- Yes. MIT is a permissive licence: you can use, modify and sell software built on it, as long as you keep its copyright and licence notices.
- Is it still maintained?
- Yes. The repository last received commits 52 days ago.
- What is it written in?
- Mainly Rust, according to GitHub's language statistics.
Answers come from the project's GitHub data, last synced on November 22, 2026, and from our analysis. They are not legal advice.
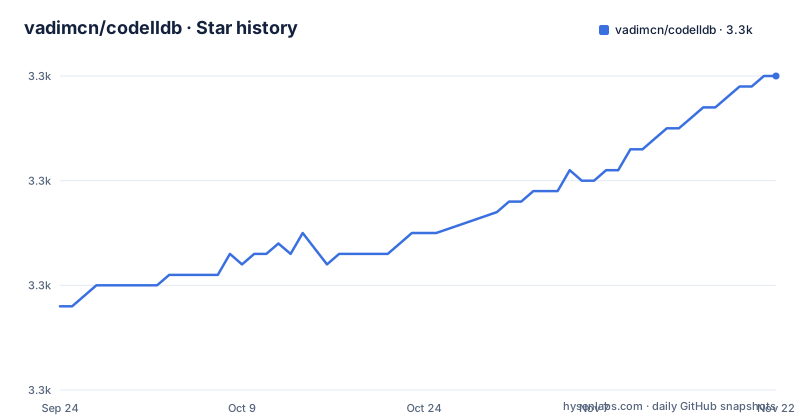
Star history
- vadimcn/codelldb3,330 ★ · +22
| Repository | 2026-09-24 | 2026-11-22 |
|---|---|---|
| vadimcn/codelldb | 3.3k | 3.3k |
22 Stars in the last 59 days, measured from the daily GitHub snapshot. Compare with other projects
Editorial analysis
Reverse debugging is still labelled experimental
The feature list runs to fourteen items and the last one carries a caveat: reverse debugging, experimental, requires a compatible backend. Everything above it is presented as settled, including the parts that are unusual for a debugger frontend. There are hardware data access breakpoints, which on LLDB means watchpoints driven by the processor rather than by polling memory. There is a disassembly view with instruction-level stepping, a memory view, a loaded modules view, and a caller exclusion mechanism so a breakpoint can skip frames above a boundary. Two entries come straight from the editor rather than the debugger: Step Into Targets, credited to a VS Code 1.46 update, and workspace-level defaults for launch configurations. HTML rendering for advanced visualizations and Python scripting round out the list.
The host list has three different version floors
Support is stated per architecture rather than per operating system, and the three lines do not share a shape. Linux needs glibc 2.18 or newer for x86_64, aarch64 or armhf, so three CPU families against one libc floor. macOS needs 10.12 or newer for x86_64 and 11.0 or newer for arm64, a five-release gap between the two halves of the same product line. Windows needs version 10 or 11 for x86_64, with a pointer to Windows notes in the wiki, and no arm64 Windows host is listed at all. So a developer on an ARM Windows machine is outside the stated matrix even though the target list is broad, and a developer on an older Intel Mac is inside it while their colleague on M-series hardware is not.
Six target architectures, most of them embedded
The target side is where the project reaches past desktop C and Rust. AArch64, ARM, AVR, MSP430, RISCV and X86 are named explicitly, which covers three desktop-class architectures and three microcontroller families. Embedded work is handled through remote debugging rather than a local adapter, and the manual is linked for that path. AVR and MSP430 have no practical use for desktop software, so their presence is the clearest signal of who the extension is also for. It also explains why the architecture list matters more than the host list: a developer on an unsupported host can still reach an embedded target, provided a machine that the host list does cover is somewhere in the loop running the debug server.
Two languages get visualizers and eight get best effort
The primary focus is stated as C++ and Rust, and those two are the ones with built-in visualizers for vectors, strings, maps and other standard library types. That is the whole of the language-specific work. Past that line the text says the extension is usable with most other compiled languages whose compiler generates compatible debugging information, and then names Ada, Fortran, Kotlin Native, Nim, Objective-C, Pascal, Swift and Zig. Eight languages on the compatible list, none of them with a visualizer. The distinction matters when you read a memory view: a container of doubles from the standard library of a focused language expands into its elements, and the same value from a language on the compatible list arrives as raw bytes or as whatever the debug information describes.
The version field in package.json is a placeholder
The manifest declares version as the literal string @VERSION@, which means no human ever edits that field by hand and something in the build substitutes it. CMakeLists.txt sits at the repository root next to BUILDING.md, so the substitution happens there rather than in a release script inside the Node tooling. The manifest is also marked private, which is the correct signal for a package that is never published to a registry and only ever produced as a VSIX. The compatibility target is engines.vscode at ^1.61.0, with @types/vscode pinned behind it at ^1.60.0 and TypeScript at ^4.7.0, so the toolchain is deliberately a version or two behind current releases. Activation events are onDebug, onUri and onStartupFinished.
Seven Rust crates and debug info in release builds
Cargo.toml defines a workspace with seven members: src/adapter-protocol, src/codelldb-launch, src/codelldb-types, src/codelldb, src/lldb-stub, src/lldb, and debuggee/rust. Six of those are the product and the seventh is a test program, which is why a debuggee/ directory appears at the repository root as well. The resolver is set to 1 and the release profile sets debug = true, so shipped binaries carry debug information rather than being stripped; for a debugger that is a deliberate choice, since stripped binaries cannot be symbolicated. Cargo configuration is split per platform into cargo_config.unix.toml and cargo_config.windows.toml, and the same split shows in the presence of adapter/, lang_support/, lldb/, syntaxes/, typings/ and webpack.config.mjs.
Python tooling points into a build directory
pyproject.toml is short and odd. autopep8 is configured with max_line_length 120, which is a style decision for the Python helper scripts rather than for the product. The pyright execution environment sets root to the repository itself, pythonVersion to 3.6, and three extraPaths: adapter/scripts, adapter/lang_support and build/lldb/lib/lldb-python. Two observations follow. The type checker is told to look for the LLDB Python bindings inside build/, a directory that only exists after a build has run, so a fresh clone will produce unresolved imports until then. And pythonVersion 3.6 is a floor rather than a target, which on a machine with no 3.6 interpreter still works but tells you nothing about the version the code is actually exercised on.
Editorial conclusion
CodeLLDB is the right pick for C++ and Rust work in VS Code, and a reasonable one for Ada, Fortran, Kotlin Native, Nim, Objective-C, Pascal, Swift and Zig where the compiler emits compatible debugging information. Before installing, check your host against the version floors, since Windows is x86_64 only and Apple Silicon macOS needs 11.0 or newer. Plan on reading MANUAL.md rather than the README, and expect to write launch.json yourself, with workspace-level defaults available if you want them shared.
Frequently asked questions
what is codelldb
CodeLLDB is a Visual Studio Code debugger extension for native code powered by LLDB, published as vscode-lldb by vadimcn and released under the MIT license. Its primary focus is C++ and Rust, with built-in visualizers for vectors, strings, maps and other standard library types, and it declares a VS Code engine requirement of ^1.61.0.
how to install codelldb
The project does not publish an install command. It is distributed through the Visual Studio Marketplace under the item name vadimcn.vscode-lldb, and the repository carries BUILDING.md and a CMakeLists.txt for anyone building the adapter and extension from source instead.
how to use codelldb in vscode
Configuration goes through launch configurations, with workspace-level defaults available so several projects share them. The extension activates on onDebug, onUri and onStartupFinished, contributes commands under the LLDB category such as Display Format, and supports Python scripting and HTML rendering for advanced visualisations. MANUAL.md is the full guide.
codelldb vscode rust
Rust is one of the two primary languages, alongside C++, and is the one that gets built-in visualizers for vectors, strings, maps and other standard library types. The Rust side of the build is a Cargo workspace whose members include the adapter crates and a debuggee/rust test program.
codelldb vs cppdbg
The project does not draw that comparison itself. What it does state is that all of LLDB's CLI commands and scripting features may be used in CodeLLDB, since the extension is powered by LLDB rather than reimplementing the debugger, and it points at the LLDB tutorial for the command surface.
Official sources
Add this badge to your README
If you maintain this project, the badge below links readers to this analysis and shows its maintenance status from the daily GitHub snapshot. Paste the markdown into your README; add ?metric=license or ?metric=stars to the image URL for a different field.

[](https://hysenlabs.com/projects/vadimcn-codelldb)Star history chart for your README
[](https://hysenlabs.com/projects/vadimcn-codelldb)Was this useful?