force-graph draws a d3 force simulation on one HTML5 canvas, in two dimensions only
Force-directed graph rendered on HTML5 canvas
At a glance
- What is it?
- vasturiano/force-graph is a JavaScript web component that lays out a graph with an iterative force simulation and paints it on a canvas. It covers 2D interaction and styling through examples, and sends 3D and React users to sibling repositories.
- Who is it for?
- Use force-graph if you need an interactive 2D node and link diagram in the browser, drawn on canvas with zoom, pan, drag and hover built in. Pick the 3D or React repositories if your target is three dimensions or a React tree.
- Can I use it commercially?
- Yes. MIT is a permissive licence: you can use, modify and sell software built on it, as long as you keep its copyright and licence notices.
- Is it still maintained?
- Yes. The repository last received commits 40 days ago.
- What is it written in?
- Mainly JavaScript, according to GitHub's language statistics.
Answers come from the project's GitHub data, last synced on November 6, 2026, and from our analysis. They are not legal advice.
Star history
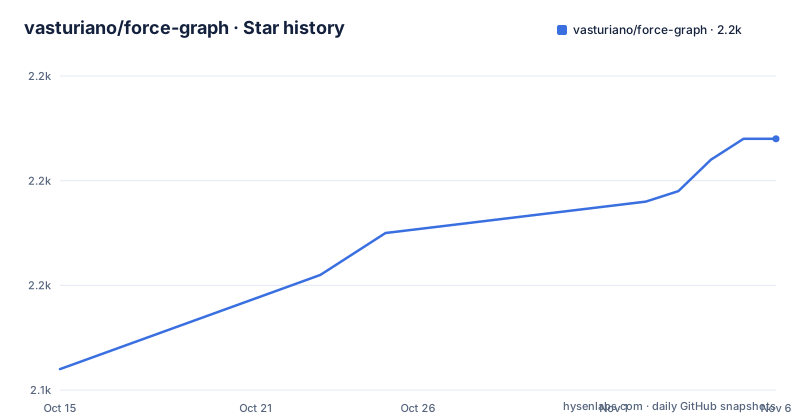
- vasturiano/force-graph2,164 ★ · +22
| Repository | 2026-10-15 | 2026-11-06 |
|---|---|---|
| vasturiano/force-graph | 2.1k | 2.2k |
22 Stars in the last 22 days, measured from the daily GitHub snapshot. Compare with other projects
Editorial analysis
A d3 physics engine moves the nodes and canvas paints them
The split of work is simple. The README says the component uses HTML5 canvas for rendering and d3-force for the underlying physics engine, and it describes the layout as force-directed and iterative: nodes repel, links pull, and positions settle over repeated ticks. package.json names the physics dependency as d3-force-3d at versions 2 to 3, a variant of d3-force that works in up to three dimensions, so the 2D package and its 3D sibling can share the same simulation code.
The component is built with kapsule, which package.json lists at ^1.16, and kapsule is the library that gives vasturiano components their configurable chart pattern. The data is a graph structure of nodes and links that you hand to the component. The README shows no API calls in the part available here, so the examples folder is the real reference for property names.
Zoom, pan, drag and hover come without extra code
Interaction is part of the component. The README states that it supports canvas zooming and panning, node dragging, and hover and click interactions on both nodes and links. Dependencies in package.json back this up: d3-zoom, d3-drag and d3-selection handle the viewport and the pointer, and float-tooltip supplies the hover tooltip.
The examples show what you do with those events. Click to focus on node centers the view on a node, Click to expand/collapse nodes hides and reveals parts of the graph, and Fix nodes after dragging pins a node where you drop it. Multiple Node Selection and Highlight nodes/links cover selection and emphasis, and Zoom/pan viewport moves the camera from code. Because the drawing is on one canvas, hover detection relies on canvas-color-tracker, another listed dependency, not on DOM events per node.
Two named examples define how far the canvas will stretch
The README links a Medium size graph of about 4k elements and a Large size graph of about 75k elements. Those are the only scale figures it gives. The examples directory also contains a folder named huge-1M, but the README does not describe that example, so its contents are not documented here.
Canvas rendering is the reason such sizes are attempted at all, since the browser does not hold a DOM element for each node. It does not remove the cost of the simulation. The force calculation still runs over every node on each tick, and the README does not say how many nodes keep an interactive frame rate on a given machine. Treat 75k as a demonstration that someone ran, not as a guarantee, and try your own dataset in the large-graph example before you commit.
Links can carry arrows, moving particles, curves and text
Link styling gets the most examples. Directional links can use arrows or moving particles, and the particles example has its own page that serves as the project homepage. Curved lines and self links shows loops that connect a node to itself, and Automatic curvature for overlapping links separates parallel edges so two links between the same nodes do not sit on top of each other.
Text in links puts a label on an edge, and Dash odd links shows per-link line styles. Emit link particles on demand fires a particle when your code asks for one, which is useful for showing an event travelling along a connection. All of these are canvas drawing, so the label and arrow options depend on the component's own renderer, not on CSS. Custom drawing beyond what the examples show means writing canvas code yourself.
Nodes can be text, images or any shape you can draw
Nodes are circles by default, and the examples show how to change that. Text as nodes and Images as nodes replace the circle, Custom node shapes draws whatever your own function paints, and Auto-colored nodes/links assigns colors automatically, with d3-scale-chromatic in the dependency list as the likely source of the palettes.
Node collision detection is a separate example, because overlap is a layout problem and the default forces do not prevent it for large custom shapes. Beeswarm chart shows the same simulation used for something other than a network: points are positioned by force so they do not overlap along an axis. The README does not explain the configuration behind these. Each example folder has an index.html that the README links as its source, so read that file for the exact property names.
DAG mode and dagre turn the simulation into a tree
Not every graph wants a free-floating layout. Force-directed tree (DAG mode) arranges a directed acyclic graph in levels, Expandable Tree combines that with expanding branches on click, and yarn.lock dependency graph (DAG mode) applies the same idea to real data. The example named Pre-computed layout (using dagre) takes the opposite route: positions are calculated by the dagre layout library first and the component only draws them.
That last example matters for one limitation. Force simulation produces layouts that depend on starting conditions and settle slowly, so two runs of the same graph can differ in shape. If you need a stable, repeatable picture of a hierarchy, the dagre example is the README's own answer, not the live simulation.
It ships as an ES module and a UMD bundle, with no GitHub releases
package.json shows version 1.52.0 under the MIT license, with main and module both pointing at dist/force-graph.mjs, a UMD build at dist/force-graph.min.js served by unpkg and jsdelivr, and TypeScript types in src/index.d.ts. The build is rollup, run with npm run build, and a prepare script builds on install from git.
The repository has no GitHub releases, so version history is only in package.json and the published package. The last push was 2026-09-28. Two sibling projects cover other needs: the README links a 3D version at vasturiano/3d-force-graph and React bindings at vasturiano/react-force-graph. This repository is neither, and it does not offer a comparison against Cytoscape or other graph libraries. The README states no comparison, so decide that on features you need.
Editorial conclusion
Use force-graph if you need an interactive 2D node and link diagram in the browser, drawn on canvas with zoom, pan, drag and hover built in. Pick the 3D or React repositories if your target is three dimensions or a React tree. Before adopting it, open the large-graph example with your own data volume and confirm the simulation stays usable, because the project publishes no performance figures.
Frequently asked questions
What is force-graph?
It is a web component that draws a graph data structure in a 2D canvas using a force-directed iterative layout. It renders on HTML5 canvas and uses d3-force for the physics.
What is react-force-graph?
The README points to React bindings at vasturiano/react-force-graph. They wrap the component for React, and they live in a separate repository from force-graph.
What is a 3D force graph?
The README links a 3D version of this component at vasturiano/3d-force-graph. force-graph itself is the 2D version rendered on a canvas.
What is force-based graph layout in force-graph?
It is an iterative layout where a physics engine positions nodes and links. force-graph runs it with d3-force on HTML5 canvas and supports zooming, panning, node dragging and hover and click interactions.
Official sources
Add this badge to your README
If you maintain this project, the badge below links readers to this analysis and shows its maintenance status from the daily GitHub snapshot. Paste the markdown into your README; add ?metric=license or ?metric=stars to the image URL for a different field.

[](https://hysenlabs.com/projects/vasturiano-force-graph)Star history chart for your README
[](https://hysenlabs.com/projects/vasturiano-force-graph)Was this useful?