Altair: a Python chart API generated from the Vega-Lite schema
Declarative visualization library for Python
At a glance
- What is it?
- Vega-Altair is a declarative statistical visualization library for Python whose API is generated from, and validated against, the Vega-Lite JSON specification. That buys schema conformance and an interactive grammar that survives export, at the cost of a fixed Python floor and optional extras for saving images.
- Who is it for?
- Altair fits exploratory work where the chart should be a value you can serialize, diff and hand to a renderer, and it fits notebooks that need linked selections without writing callbacks. It is the wrong tool when you need to save an image without adding an extra, when you are locked to Python 3.10 or older, or when your chart needs computation the Vega-Lite grammar has no expression for.
- Can I use it commercially?
- Yes. BSD-3-Clause is a permissive licence: you can use, modify and sell software built on it, as long as you keep its copyright and licence notices.
- Is it still maintained?
- Yes. The repository last received commits 1 day ago.
- What is it written in?
- Mainly Python, according to GitHub's language statistics.
Answers come from the project's GitHub data, last synced on November 14, 2026, and from our analysis. They are not legal advice.
Star history
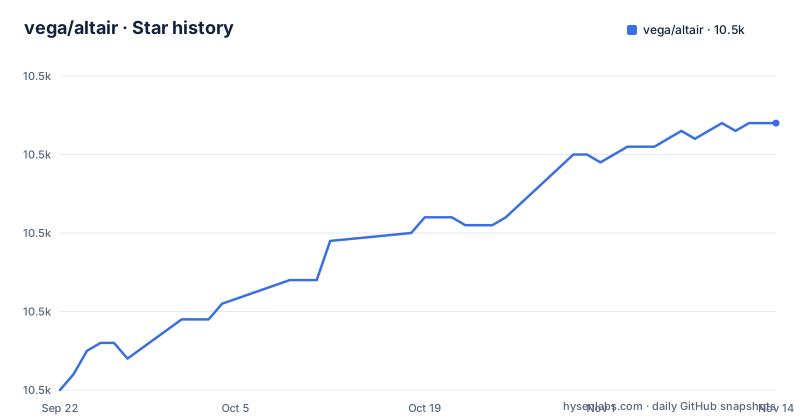
- vega/altair10,514 ★ · +34
| Repository | 2026-09-22 | 2026-11-14 |
|---|---|---|
| vega/altair | 10.5k | 10.5k |
34 Stars in the last 53 days, measured from the daily GitHub snapshot. Compare with other projects
Editorial analysis
The Python API is generated from the Vega-Lite schema, not hand written
Altair does not define a chart vocabulary of its own. Every mark, encoding channel and selection type in the Python namespace is auto-generated so that it conforms to the Vega-Lite JSON specification, and the runtime carries jsonschema>=4.18.0 to check what you build against that schema. One consequence follows. Your chart compiles to JSON, so anything the Vega-Lite grammar cannot express is unreachable from Python regardless of how the documentation is worded. The jsonschema floor is pinned for a stated reason in pyproject.toml: 4.18.0 is the first release providing the referencing registry API, and it is the release that deprecated jsonschema.RefResolver.
requires-python is 3.11 and the version string is produced at build time
pyproject.toml sets requires-python to >=3.11, and the classifiers cover 3.11, 3.12, 3.13 and 3.14, so older interpreters have no supported path. The runtime dependency list is short on purpose: typing_extensions>=4.12.0 where python_version is below 3.15, then jinja2, jsonschema, packaging and narwhals>=2.4.0. The version number is not written into the file at all. It appears under dynamic and is supplied at build time by versioningit, with hatchling as the build backend. That arrangement explains two things a reader will notice. The root carries uv.lock, so the project environment itself is pinned even though the published version is generated. And the contributor toolchain is uv with ruff and pytest rather than a hand-built environment. A project that vendors Altair into a locked application is therefore tracking a backend that rewrites the version string on each release, while the dependency floor it exposes to users stays fixed at 3.11.
The base install carries no data stack, so saving a chart needs an extra
The base package installs jinja2, jsonschema, packaging, narwhals and typing_extensions, and nothing else. Data handling and image output are optional dependencies. The save extra pulls vl-convert-python>=1.9.0, and the all extra adds altair[save] together with pandas>=1.5.3, numpy, pyarrow>=11, vegafusion>=2.0.3 and anywidget. That split is where most first-run confusion begins. A plain pip install altair gives a library that composes and displays a specification but cannot write a PNG or an SVG on its own, because the converter that performs that work ships in the save extra. The dataframe layer is not a core dependency either, so a script assuming pandas arrived alongside Altair is wrong in a clean environment. The trade is size: taking all is a heavier tree than a notebook that only ever draws a chart, and a scheduled job that only needs PNG can install save and leave the dataframe machinery out.
Interaction lives in the grammar, so a brush filter travels with the JSON
The distinctive piece is that selection is declarative too, inherited from Vega-Lite rather than bolted on as Python callbacks. A brush is constructed as a value, attached with add_params, and then consumed by a second chart through transform_filter, and the two views are composed with &:
import altair as alt
from altair.datasets import data

source = data.cars()

brush = alt.selection_interval()

points = alt.Chart(source).mark_point().encode(
    x="Horsepower",
    y="Miles_per_Gallon",
    color=alt.when(brush).then("Origin").otherwise(alt.value("lightgray")),
).add_params(
    brush
)

bars = alt.Chart(source).mark_bar().encode(
    x="count(Origin)",
    y="Origin",
    color="Origin",
).transform_filter(
    brush
)

points & bars
The grey fallback in the when, then, otherwise chain is what makes the linked view readable: points outside the brush fall back to lightgray while the histogram counts only what is selected. For a reader the point is that interactivity is part of the emitted document rather than Python state. It survives export to a stand-alone HTML page or the Online Vega-Lite Editor, and it vanishes from a static image. Any logic the grammar cannot express still has to live outside the chart.
Altair emits JSON and something downstream does the drawing
The object you build is a specification, and rendering belongs to someone else. Display paths named are JupyterLab, Jupyter Notebook, Visual Studio Code, GitHub and nbviewer. Export paths are PNG and SVG images, stand-alone HTML pages and the Online Vega-Lite Editor, and charts serialize as JSON files. That last detail explains why GitHub sits in the display list: a spec that is pure JSON can be rendered by a host with no Python installed at all. The plainest starting point looks like this:
import altair as alt

# load a simple dataset as a pandas DataFrame
from altair.datasets import data

cars = data.cars()

alt.Chart(cars).mark_point().encode(
    x="Horsepower",
    y="Miles_per_Gallon",
    color="Origin",
)
Note the chain order in both examples: the mark call first, then encode, never the reverse. The data can be a pandas DataFrame you built or one of the bundled datasets such as data.cars(), which is how the examples here avoid shipping a CSV. The README does not document a headless server rendering path beyond the save extra, so a service that has to return an image per request needs that extra in place first.
The name collides with a star, a car and an engineering company
Vega-Altair was originally developed by Jake Vanderplas and Brian Granger in close collaboration with the UW Interactive Data Lab, and the README states that the open source project is not affiliated with Altair Engineering, Inc. That disclaimer exists because the name is crowded. Altair and Vega are both astronomy terms as well as project names, and an unrelated engineering company is also called Altair. What actually identifies the software is the layering. The layering is the concrete answer: Altair is the Python layer, Vega-Lite is the JSON grammar it compiles down to, and the documentation site and the tutorial notebooks live under the altair-viz name. For help, that tag is where a question the documentation does not address should go, and a GitHub issue is the channel for bugs and feature requests.
Contributors work through uv, ruff, pytest and mypy, with two checkers experimental
The repository root shows what a contribution can touch: doc/, sphinxext/, tests/, tools/, _data/, design/, images/, paper/, and two files that are aimed at different readers, NOTES_FOR_MAINTAINERS.md and RELEASING.md, plus CONTRIBUTING.md, which the README names as the place for the actual procedure. Tool configuration in pyproject.toml is organised for hatch, ruff, pytest and mypy, with pyright and ty both marked experimental, and uv.lock pins the environment. For a newcomer, CONTRIBUTING.md is the file the README points to. Nothing in the README describes a review turnaround or a support window, so neither the StackOverflow tag nor the issue tracker comes with a promised response time. The project is not archived, its last push landed on 2026-11-01, and v6.3.0 was tagged on 2026-09-15 after v6.2.2 on 2026-06-23, so the minor version moves as the surface changes.
Editorial conclusion
Altair fits exploratory work where the chart should be a value you can serialize, diff and hand to a renderer, and it fits notebooks that need linked selections without writing callbacks. It is the wrong tool when you need to save an image without adding an extra, when you are locked to Python 3.10 or older, or when your chart needs computation the Vega-Lite grammar has no expression for. Before adopting it, install the save extra if images matter, confirm your Python is 3.11 or newer, and run the README's linked-selection example.
Frequently asked questions
What is Altair and Vega?
Vega-Altair is a declarative statistical visualization library for Python built on top of the Vega-Lite JSON specification. Altair is the Python layer, Vega-Lite is the grammar it compiles to, and the documentation site and the tutorial notebooks are published under the altair-viz name.
how to install altair
The package installs with pip install altair, and the conda equivalent is conda install altair -c conda-forge. The declared floor is requires-python >=3.11, with classifiers covering 3.11 through 3.14, and full installation instructions live on the documentation site.
how to use altair
Build a chart by chaining onto alt.Chart, calling a mark and then encode, starting from a pandas DataFrame or a bundled dataset such as data.cars(). Charts display in JupyterLab, Jupyter Notebook, Visual Studio Code, GitHub and nbviewer, and export to PNG, SVG, stand-alone HTML or the Online Vega-Lite Editor.
Is there a star named Altair?
This repository is a Python visualization library, not an astronomy project. Vega-Altair was originally developed by Jake Vanderplas and Brian Granger in close collaboration with the UW Interactive Data Lab, and the open source project is not affiliated with Altair Engineering, Inc., which is where most of the name confusion comes from.
Official sources
Add this badge to your README
If you maintain this project, the badge below links readers to this analysis and shows its maintenance status from the daily GitHub snapshot. Paste the markdown into your README; add ?metric=license or ?metric=stars to the image URL for a different field.

[](https://hysenlabs.com/projects/vega-altair)Star history chart for your README
[](https://hysenlabs.com/projects/vega-altair)Was this useful?