modelsummary: regression tables and data summaries for R without writing the LaTeX
Beautiful and customizable model summaries in R.
At a glance
- What is it?
- modelsummary turns fitted models into side-by-side regression tables, coefficient plots, balance tables, correlation matrices and cross-tabulations in R, with output to HTML, LaTeX, Word, Powerpoint, Excel, PDF and images. Its design leans on broom, parameters and the table-building packages rather than implementing formatting and model support itself.
- Who is it for?
- Adopt modelsummary when you produce papers, reports or slides from R models and spend time on table formatting, because it handles the boring parts of side-by-side regressions, adjusted standard errors, significance stars and export formats in one call. Skip it if you already have a table pipeline you are happy with, since the package is deliberately a layer over other tools rather than a replacement for them.
- Can I use it commercially?
- Check first. The repository uses a licence we do not classify automatically, so read its LICENSE file before any commercial use.
- Is it still maintained?
- Yes. The repository last received commits 32 days ago.
- What is it written in?
- Mainly HTML, according to GitHub's language statistics.
Answers come from the project's GitHub data, last synced on November 7, 2026, and from our analysis. They are not legal advice.
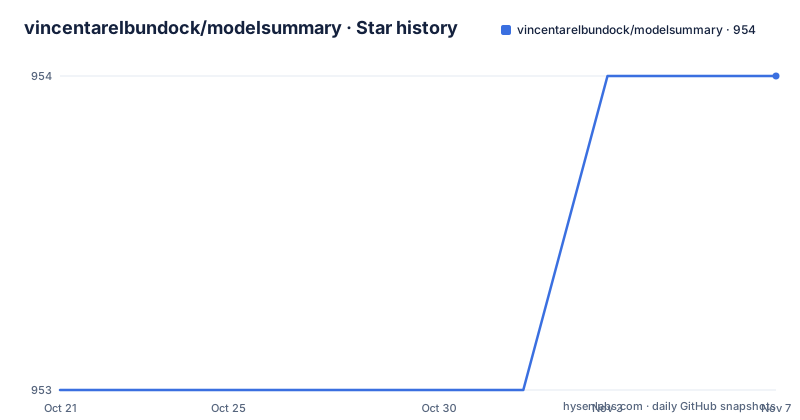
Star history
- vincentarelbundock/modelsummary954 ★ · +1
| Repository | 2026-10-21 | 2026-11-07 |
|---|---|---|
| vincentarelbundock/modelsummary | 953 | 954 |
1 Stars in the last 17 days, measured from the daily GitHub snapshot. Compare with other projects
Editorial analysis
Two families of functions: models and data
modelsummary creates tables and plots to present descriptive statistics and to summarize statistical models in R. The package documentation splits its functions into two groups, and the split tells you what the package is for.
The model summary family is small. modelsummary produces regression tables with side-by-side models, and modelplot produces coefficient plots.
The data summary family is larger and covers the descriptive side of a paper. datasummary is described as a powerful tool to create multi-level cross-tabs and data summaries, datasummary_crosstab does cross-tabulations, datasummary_balance produces balance tables with subgroup statistics and difference in means, which is the Table 1 that reviewers ask for, datasummary_correlation produces correlation tables, datasummary_skim gives a quick overview of a dataset, and datasummary_df turns dataframes into nice tables with titles and notes.
That division mirrors how the work actually happens. A regression table summarises a model you have fitted, and a balance table summarises a sample you have not modelled at all. Doing both from one package means the same styling, the same export path and the same output formats apply to the descriptive tables and the inferential ones.
The audience is researchers and analysts who already work in R and need publication-shaped output. The package is not a modelling library and does not replace the one you use to fit the model. It is the layer that turns a fitted object into something you can put in a document.
One call produces the table, and one word changes the format
The stated selling point is that modelsummary is very easy to use, and the example given is deliberately minimal:
library(modelsummary)

mod <- lm(mpg ~ hp, data = mtcars)

modelsummary(mod)
That command automatically displays a summary table in the RStudio Viewer or in a web browser. All you need is one word to change the output format, and a text-only version can be printed to the console with:
modelsummary(mod, output = "markdown")For files, the output argument takes a filename with an extension, and the documentation shows Word and LaTeX files being written that way:
modelsummary(mod, output = "table.docx")
modelsummary(mod, output = "table.tex")
The design point is that the format is a parameter rather than a separate function. There is no modelsummary_to_word and no modelsummary_to_latex, so the code that produces a table does not change when you switch destination. For a pipeline that emits a Markdown table into a Quarto document and a Word file for a collaborator, that is the difference between one branch and several.
The list of destinations is long. Tables can be saved to HTML, LaTeX, Text/Markdown, Microsoft Word, Powerpoint, RTF, JPG, or PNG formats, and the package description also names Excel and PDF among the export formats available.
The cost of that breadth is that the package depends on other packages to produce several of those formats, which is the subject of a later section.
What goes in the table is configurable, and it is the main dial
The information utilities are where a lot of the real work of a regression table happens, and the package lists them in detail.
You can rename, reorder, subset or omit parameter estimates, which matters when a model has twenty terms and the table should show four. You can choose the set of goodness-of-fit statistics to include. You can display various adjusted standard errors or confidence intervals. You can add titles, footnotes or source notes. You can insert stars or custom characters to indicate levels of statistical significance. And you can add rows with supplemental information about your models.
Adjusted standard errors deserve a word of their own, because producing them is the step most often done by hand in a research workflow, with results that then have to be re-checked every time the model changes. Having the package handle it means the table and the model cannot drift apart.
The same idea extends to the appearance, but through a different route. The table packages supported for customisation are tinytable, gt, kableExtra, huxtable, flextable, and DT, and the plots are customised with ggplot2. The appearance customisation page shows tables with coloured cells, spanning column labels, row groups, titles, source notes, footnotes and significance stars.
So the package is explicit about the division of labour: content is decided in modelsummary arguments, and appearance is decided by whichever table engine you plug in. That is a sensible design for a package that has to produce a journal table and a slide in the same week.
Model coverage is inherited from broom and parameters
The claim about supported models is unusually strong, and the mechanism behind it explains the claim.
Thanks to the broom and parameters packages, modelsummary supports hundreds of statistical models out-of-the-box. Installing other packages extends the capabilities further, with broom.mixed given as an example. It is also easy to add or customise your own models.
This is the single most important architectural fact about the package, and it is stated plainly in the community section: modelsummary does not try to do everything, and instead builds on top of the work of the R community. By building on broom and parameters it already supports hundreds of model types, and by using the table packages it produces the output.
The consequence for a user is that support is a function of the ecosystem, not of this package. If your model type is not covered, the answer is usually that a package exists for it, or that you write the extraction yourself, rather than that the project has not caught up.
The benefit is stated in the README too. When external packages improve, modelsummary improves as well, and leaning on external packages allows modelsummary to have a massively simplified codebase relative to other similar packages, which the README argues improves long term maintainability and lets contributors participate through GitHub.
The trade is dependency risk. A package that supports hundreds of models through other packages inherits their version requirements, and a table that renders beautifully on one version of gt may not render identically on another.
The package is tested, and the build pipeline shows how
The package is developed using a suite of unit tests with about 95% coverage, so the documentation claims, it probably will not break. The test suite lives in inst/tinytest and runs through scrutin, which also provides a terminal user interface for running tests in watch mode.
The Makefile at the repository root shows the development workflow in full. The test target runs the full tinytest suite via scrutin, and testone runs a single test file filtered by stem, with the .R stripped from the name. The document target renders NEWS.qmd and then calls devtools::document(), and check runs document followed by devtools::check(), which is the standard package validation step. Install runs devtools::install with dependencies set to false, and deps installs with dependencies set to true.
Documentation and publishing have their own targets. The deploy target calls pkgdown::deploy_to_branch() for the website, while website installs the package, removes the docs directory, renders the vignettes and site with altdoc::render_docs, copies the man figures into the site, and restores the CNAME file from git. The buildpdf target produces a reference manual with R CMD Rd2pdf.
Two things stand out for an adopter. The NEWS file is written as NEWS.qmd and rendered through quarto, so release notes are produced from a formatted source rather than by hand. And the site is rebuilt from the vignettes rather than maintained separately, which keeps the documentation and the package in step.
The rest of the repository follows the same pattern: DESCRIPTION and NAMESPACE at the root, man pages and man-roxygen templates, vignettes, tests, a .lintr configuration for linting, a .scrutin directory for the test runner, codecov.yml for coverage reporting, and a .covrignore.
It is a well-tended R package, and the tooling is visible in the repository rather than hidden.
Where it fits against hand-rolled LaTeX, and where it stops
The alternative to a package like this is the pipeline every graduate student writes once: a script that extracts coefficients, a LaTeX template that formats them, and a Makefile that stitches the document together. It works, and it is miserable to maintain, because every new model type and every new journal style is a change to the script.
The modelsummary approach replaces the script with function arguments and replaces the template with a table engine. The gain is clearest when a paper reports several models side by side, since the alignment of rows across columns is exactly the part that hand-rolled code handles worst.
The limits are worth being clear about. The package does not fit your model, and it does not decide what belongs in the table. It also does not own the appearance, so a journal that demands a very specific layout still requires work in the underlying table package. And since the output engines are separate packages, the exact rendering of a table can shift with an update to gt or flextable, which is the flip side of the approach that keeps the codebase small.
A design decision in the README is worth repeating because it explains the philosophy. modelsummary is reliably dangerous, and it allows users to do stupid stuff like inserting squirrels in all your tables. That is a joke, but it points at the actual stance: the package is a presentation tool, and it will happily produce whatever you ask for.
Version and licence status of the R package
The package is installed from CRAN, and the homepage is modelsummary.com, which is where the vignettes live.
On versions, three releases are listed: 2.2.0 on 2024-09-02, 1.4.3 on 2023-10-15 and 1.4.1 on 2023-05-29. The jump from 1.4.x to 2.2.0 in the release list suggests a substantial development period between the two, and the 2.x line is what a new user should expect to install from CRAN.
The repository itself is not archived and the last push was on 2026-10-06, so development continues after the most recent tagged release. That gap between the CRAN version and the repository is the normal pattern for an R package, where the CRAN copy is what users get and the repository is where the next release is being prepared.
On licensing, the README carries a badge for GPLv3 and links to a LICENSE.md file in the repository, while the project's own metadata records the licence as one GitHub cannot classify, pointing to the file. For a package that many research groups use in commercial consulting work, that distinction matters, so read LICENSE.md rather than relying on the badge alone.
A reference is also given for the underlying approach, Arel-Bundock, 2022, in the Journal of Statistical Software at volume 103, issue 1, with a DOI listed in the README. That citation is the thing to point at when a colleague asks why the tables in a paper were produced this way.
Editorial conclusion
Adopt modelsummary when you produce papers, reports or slides from R models and spend time on table formatting, because it handles the boring parts of side-by-side regressions, adjusted standard errors, significance stars and export formats in one call. Skip it if you already have a table pipeline you are happy with, since the package is deliberately a layer over other tools rather than a replacement for them. Before adopting, check the model types you need are covered through broom and parameters, decide which table package you will use for appearance, and confirm that the CRAN version supports the features you need, since the most recent tagged release listed is 2.2.0.
Frequently asked questions
How do I create a regression table with modelsummary in R?
Fit your model, then pass it to modelsummary. The example in the documentation fits lm(mpg ~ hp, data = mtcars) and calls modelsummary(mod), which displays a summary table in the RStudio Viewer or a web browser. Changing the output argument changes the destination, for example output = "markdown" to print to the console.
Which output formats does modelsummary support?
Tables can be saved to HTML, LaTeX, Text/Markdown, Microsoft Word, Powerpoint, RTF, JPG and PNG, and the package description also names Excel and PDF. Tables and plots can also be embedded in rmarkdown, knitr or Sweave documents.
Does modelsummary produce balance tables and correlation matrices?
Yes. datasummary_balance creates balance tables with subgroup statistics and difference in means, datasummary_correlation creates correlation tables, datasummary_crosstab does cross-tabulations, datasummary_skim gives a quick overview of a dataset, and datasummary_df turns dataframes into tables with titles and notes.
Which model types does modelsummary support?
Because it builds on the broom and parameters packages, modelsummary supports hundreds of statistical models out-of-the-box, and installing further packages such as broom.mixed extends that. Adding or customising your own models is documented as an easy task.
How is the appearance of modelsummary tables customised?
The appearance is handled by external table packages, including tinytable, gt, kableExtra, huxtable, flextable and DT, while the coefficient plots are customised with ggplot2. The information in the table, such as renaming or omitting estimates, choosing standard errors, adding notes or significance stars, is set through modelsummary arguments.
Official sources
Add this badge to your README
If you maintain this project, the badge below links readers to this analysis and shows its maintenance status from the daily GitHub snapshot. Paste the markdown into your README; add ?metric=license or ?metric=stars to the image URL for a different field.

[](https://hysenlabs.com/projects/vincentarelbundock-modelsummary)Star history chart for your README
[](https://hysenlabs.com/projects/vincentarelbundock-modelsummary)Was this useful?