wbh604/fund-guy-skill: eight years of a fund manager's trades, checked against twelve months of forward prices
A playful, pun-based skill (jilaoskill) for quickly and easily screening investment funds.
At a glance
- What is it?
- Fund Guy Skill takes a fund code, pulls every buy and sell the manager made over eight years, verifies each against what the holding did over the following twelve months, and emits a 700KB self-contained HTML report. It grades behaviour rather than net asset value, and it is explicit about what it cannot verify.
- Who is it for?
- Fund Guy Skill fits an investor who already distrusts a platform rating and wants the trades themselves examined, since the report shows every buy and sell against the following year of prices rather than a score with no workings. It is a poor fit if you want a fund manager's job description or a data provider, since the tool does neither, or if you want the three report styles populated with real figures, because those are currently simulated data.
- Can I use it commercially?
- Yes. MIT is a permissive licence: you can use, modify and sell software built on it, as long as you keep its copyright and licence notices.
- Is it still maintained?
- Yes. The repository last received commits 73 days ago.
- What is it written in?
- Mainly HTML, according to GitHub's language statistics.
Answers come from the project's GitHub data, last synced on November 15, 2026, and from our analysis. They are not legal advice.
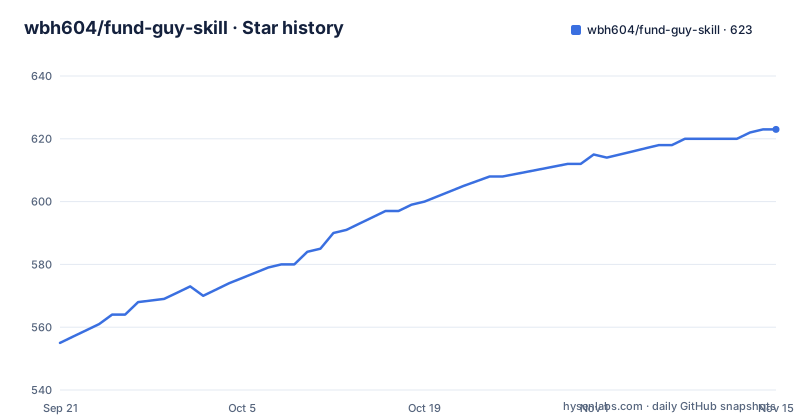
Star history
- wbh604/fund-guy-skill623 ★ · +68
| Repository | 2026-09-21 | 2026-11-15 |
|---|---|---|
| wbh604/fund-guy-skill | 555 | 623 |
68 Stars in the last 55 days, measured from the daily GitHub snapshot. Compare with other projects
Editorial analysis
Eight years of trades, each checked twelve months forward
The unit of analysis is a single decision, and the test applied to it is fixed.
You give it a fund code. The agent pulls out every buy and sell the manager made across eight years, then takes each one and checks it against what the holding actually did over the following twelve months. The output is one self-contained HTML file of about 700KB containing a chart-by-chart replay, an autopsy of each buy and sell point, an independence trial against the rest of the firm's holdings, and a check for inflated reputations.
That twelve-month horizon is the core design choice. A platform rating is built from returns and years in the industry, so it says nothing about whether a sale was well timed. This tool grades the timing itself, which is why the report leads with a verdict page carrying a total out of 100 alongside whatever the platform scored the same manager.
The stated principle is that every conclusion is recomputable and sourced, and that anything which cannot be checked is labelled unverified rather than filled in. That is the opposite of the usual approach to a research report, and it shows up in the methodology as a rule rather than as a disclaimer.
Seven install paths for one Python entry point
The installation section is the longest part of the file, and it is organised by which agent you are using rather than by package manager.
For OpenClaw the instruction is a single clone-and-install line that places the repository straight into the skills directory and installs its requirements. For Claude Code there are two routes: a plugin route that adds the repository as a marketplace and installs one named plugin, which then exposes three slash commands for a full audit, a five-minute quick check, and a holdings-overlap reverse lookup; and a skill route that is a plain clone, after which opening the directory is enough because the skills folder is discovered automatically.
Codex and Cursor get prose instructions rather than commands. For Codex the text asks the agent to clone, install requirements, and run the entry point with a no-browser flag. For Cursor you open the repository folder and the project skills are discovered, after which you ask for the analysis in a sentence.
Windsurf, Devin and other agents are covered by a generic agent guide at the repository root plus a project skills directory that most agents recognise on open. The last route is the plain command line:
git clone https://github.com/wbh604/fund-guy-skill.git
cd fund-guy-skill && pip install -r requirements.txt
python run.py 163417
Seven routes, one entry point, four dependencies.
The score has three weights and one honest subtitle
The verdict page shows a total and the weights that produce it.
In the worked example the total is 62, split into timing at 35 percent, control at 35 percent, and quality of excess return at 30 percent. The claim attached is that every point is reproducible from a rule. Beside it sits a comparison panel putting that 62 next to the 84 a mainstream platform assigns the same manager, with the difference attributed mainly to the platform not examining when he sold.
Three weights, and two of them are about restraint rather than returns. Control at the same weight as timing is the interesting one: it is the score that rewards cutting a loser rather than holding it, which is the component a return-based rating cannot express at all.
The style of the presentation is deliberately judicial. The manager is treated as the subject of an investigation, with the verdict, the platform comparison and the evidence sections laid out as pages of a file. That framing is one of three available skins, and it is the one used for the published example, which is fund 163417 with the manager's name and photograph redacted so the demo can be hosted.
Eighty one actions autopsied, and the exits are the weak part
The trade-by-trade section is the part with numbers in it, and the shape of the result is the finding.
The worked example autopsies 65 buys and 16 full liquidations. A buy counts as a win if the holding outperformed the market over the following year, and the win rate on buys is 58 percent. The rate at which a full liquidation avoided a subsequent decline is 31 percent. The one-line conclusion drawn from those two numbers is that the manager can buy and cannot sell.
A separate panel covers what happened after a holding fell below its cost price: 32 actions, of which 20 cut the position and 12 bought more on the way down, which is read as a discipline-leaning record rather than one that holds losers indefinitely.
The report also shows the best and worst decisions by name, with the largest gain from adding to a position and the largest regret from liquidating one that then rose. That panel exists for a stated reason: writing up only the winners would remove the credibility of everything else, which is also written into the methodology rules as an absolute.
Where a passive reduction happened, such as a threshold trigger or a redemption, it is excluded from the record rather than counted as a decision.
Comparison cards that stay out of the total
Several panels are computed and then deliberately excluded from the score, and the file says so rather than quietly including them.
Three of them are comparison cards. The first pins subscription-limit and open-door events from fund announcements onto market highs and lows, then checks over the following twelve months whether the manager actually stopped people from buying at the top. The second compares his fourth quarter against his other quarters for a year-end ranking push. The third checks whether the products under the same manager hold substantially the same names, and then what happened to the money that arrived in a batch when a fund reopened.
None of the three contributes to the total. Each is there to be looked at beside it.
The separation is the point. A tenure-segmentation rule forbids mixing a predecessor's record into the incumbent's evaluation, a rule against treating beta as alpha requires style-gifted returns to be stripped before any skill claim, and evidence that cannot be obtained is marked with a code for unidentified rather than written as absent. Those rules exist so the headline number stays narrow enough to defend.
A decomposition panel does the stripping explicitly: 103 months of return are attributed across market, size and growth-versus-value, and what remains after removing the style contribution is the figure treated as the manager's own.
Ten data sources, no API key, everything cached as evidence
The sourcing table is the part that decides whether any of the numbers can be checked.
Everything is free and no API key is required. Net asset value, fund size, subscription and redemption figures, holder data, manager profiles and platform scores come from a mainstream fund site. Quarterly holdings and rankings come from the same provider through an open finance library, as does the heavy-holding industry classification for both mainland and Hong Kong listings, plus management and custody fee pages and the other products under a manager.
Market data is split by market. A-share weekly candles come from one library, with forward adjustment applied, and Hong Kong weekly candles come from a different provider. Fund announcements supply the subscription gate events, a cross-section of holdings across the whole market comes from a disclosure site through the same library, and the charting library used in the report is TradingView Lightweight Charts under Apache 2.0.
The rule attached to all of it is stricter than the sourcing itself. Raw responses are written to a cache directory that is not committed, each entry recording which interface was called with which parameters and when, and a number with no traceable source may not enter the report. The report also carries its own data-source annotation at the end, so a reader can start from the output rather than the repository.
The runtime dependencies are four: that finance library, the market data library, pandas and requests.
One methodology, three report skins, and a data caveat
The visual variety is larger than the analytical variety, and the file is careful to say so.
Beyond the main report there are three complete style prototypes described as three entirely different narrative skins over the same methodology. The first is a detective dossier with kraft paper, a stamp and margin annotations, treating the manager as a suspect with a personnel file, physical evidence and a closing statement. The second recasts the manager as a collectible card, with rarity, a stats panel, battle records, a death replay and a power ranking. The third is a medical checkup, with an overall conclusion, departments, medical history and prescriptions.
Each has a hosted example. The important qualifier sits with them: they are currently a simulated data demonstration, usable as rendering templates to switch between.
So a reader looking at the card or checkup skins is looking at invented numbers in a real layout. Only the main report's worked example is described as coming from a real analysis.
That distinction is easy to miss and worth stating plainly, because the skins are the more shareable artefacts and they are the ones that are populated with placeholder figures.
The changelog is about switching funds and about broken previews
Only two entries are visible in the log, and each fixes a specific failure rather than adding a feature.
The earlier entry, dated 14 August 2026, is titled around making fund switching automatic. Its substance is the removal of hand-written comparison tables specific to the demo fund. Industry grouping, fees, the chart window, the peer and market cross-section years, the gate style index and the peer comparison all became recomputed from whichever fund you selected, the holdings grouping stopped hard-coding a growth-technology framing, the peer list stopped being limited to two named fund codes, and the chart events for fund milestones are now generated from the selected fund rather than replaying the demo fund's timeline.
The later entry, dated 3 September 2026, is about a broken preview. The report depends on embedded scripts, and a common GitHub preview service does not run them, so a correct report looks empty with a zero score. The instructions are now to open the local HTML in a browser, and the report was changed so the score shows and progress bars render without scripts. The same entry tightens the whole-market overlap to only the latest top ten holdings rather than treating a full interim or annual report as heavy holdings, removes bond and index funds from the peer group, excludes other products the same manager runs, auto-annotates index moves of five percent or more instead of inventing macro news, and validates that a downloaded manager photo is really an image.
The repository itself is MIT licensed with no releases, and the last push to the default branch main is dated 3 September 2026.
Editorial conclusion
Fund Guy Skill fits an investor who already distrusts a platform rating and wants the trades themselves examined, since the report shows every buy and sell against the following year of prices rather than a score with no workings. It is a poor fit if you want a fund manager's job description or a data provider, since the tool does neither, or if you want the three report styles populated with real figures, because those are currently simulated data. Before you rely on a number from it, check three things: that the tenure of the manager being judged is separated from their predecessor's, that style-gifted returns have been stripped before any skill claim is made, and whether anything you are shown is marked unverified rather than absent, since the methodology treats those two as different.
Frequently asked questions
What does Fund Guy Skill actually analyse?
You give it a fund code and it pulls out every buy and sell the manager made over eight years, then checks each one against what that holding did over the following twelve months. The output is one self-contained HTML report of roughly 700KB that you can open offline.
How is the Fund Guy Skill score calculated?
The total in the worked example is 62, weighted as timing at 35 percent, control at 35 percent and quality of excess return at 30 percent. The same manager is shown next to the 84 a mainstream platform assigns, the difference being attributed mainly to the platform not examining when he sold.
How do I install Fund Guy Skill for a plain command line run?
Clone the repository, install its requirements and run the entry point with a fund code. There are six other documented routes, covering OpenClaw, Claude Code as a plugin, Claude Code as a skill, Codex, Cursor, and Windsurf, Devin and other agents.
Where does Fund Guy Skill get its data, and does it need an API key?
No API key is needed and all sources are free. Data comes from a mainstream fund site, Eastmoney and a disclosure site through an open finance library, two market data libraries for A-share and Hong Kong candles, and fund announcements, with charting from TradingView Lightweight Charts.
Are the three alternative report styles populated with real data?
No. The dossier, card and checkup styles share the main report's methodology but are currently a simulated data demonstration, usable as rendering templates. Only the main report's worked example, for fund 163417 with the manager redacted, is described as coming from a real analysis.
Official sources
Add this badge to your README
If you maintain this project, the badge below links readers to this analysis and shows its maintenance status from the daily GitHub snapshot. Paste the markdown into your README; add ?metric=license or ?metric=stars to the image URL for a different field.

[](https://hysenlabs.com/projects/wbh604-fund-guy-skill)Star history chart for your README
[](https://hysenlabs.com/projects/wbh604-fund-guy-skill)Was this useful?