tracerr attaches a stack trace and the failing source lines to a Go error
Golang errors with stack trace and source fragments.
At a glance
- What is it?
- A dependency-free Go package that wraps errors with a captured stack, then prints the offending source lines in colour, either to stdout or into a string, with a README that publishes the allocation cost of the capture.
- Who is it for?
- Adopt tracerr if your team debugs Go programs from logs and stack traces alone, since the source fragment is the piece those outputs leave out, and if the allocation cost of capturing a stack is acceptable at your error rate. Do not adopt it in a hot path where errors are returned routinely rather than exceptionally, and do not expect it to replace the standard wrapping verbs, since it captures the stack at the point of the wrap rather than at the origin of the failure.
- Can I use it commercially?
- Yes. MIT is a permissive licence: you can use, modify and sell software built on it, as long as you keep its copyright and licence notices.
- Is it still maintained?
- Activity is slowing. The repository last received commits 7 months ago.
- What is it written in?
- Mainly Go, according to GitHub's language statistics.
Answers come from the project's GitHub data, last synced on November 7, 2026, and from our analysis. They are not legal advice.
Star history
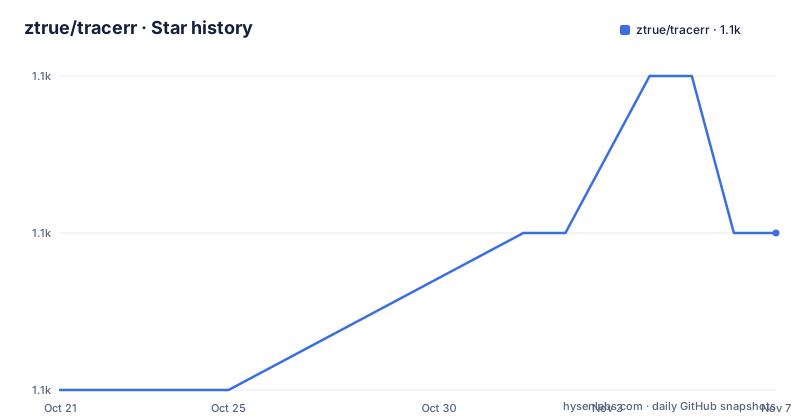
- ztrue/tracerr1,127 ★ · +1
| Repository | 2026-10-21 | 2026-11-07 |
|---|---|---|
| ztrue/tracerr | 1.1k | 1.1k |
1 Stars in the last 17 days, measured from the daily GitHub snapshot. Compare with other projects
Editorial analysis
The gap tracerr fills: a stack trace says where, not what
A Go stack trace tells you the chain of function calls that were in flight when an error surfaced. It does not tell you what the offending line looked like. For a program that fails in production and is debugged from a log file, that means reading the trace, finding the file and the line number, then opening the source at the right revision, which is often not the revision that is running.
tracerr is a small package that closes that gap. Its description is Golang errors with stack trace and source fragments, and the README's example shows a function that returns an error from a missing file, wrapped with a stack trace, then printed with the source code included:
func read() error {
	return readNonExistent()
}

func readNonExistent() error {
	_, err := ioutil.ReadFile("/tmp/non_existent_file")
	// Add stack trace to existing error, no matter if it's nil.
	return tracerr.Wrap(err)
}
The example is deliberately trivial, a read of a file that does not exist, because the point is what the output looks like rather than what the program does.
The package is written in Go, it is MIT licensed, and its module declaration is the only line in go.mod:
module github.com/ztrue/tracerrThere is no require block, so the library has no dependencies at all. That matters for a debugging aid, because a package that people put in to diagnose a problem is one you do not want to add a supply chain to. The source is a handful of files, error.go for the error type and the capture, print.go for the output, and colors.go for the colouring, with the tests split into error_test.go, print_test.go and error_bench_test.go.
The API surface: New, Errorf, Wrap and the print family
The whole interface is small enough to read in one sitting. Creating an error with a stack attached takes one call:
err := tracerr.New("some error")or the formatted variant:
err := tracerr.Errorf("some error %d", num)Attaching a stack trace to an error you already have is the Wrap call, and the README states the nil behaviour explicitly: if err is nil then it will still be nil with no stack trace added. That matters more than it sounds, because a common pattern is to wrap at every layer of a call chain without checking, and a wrapper that turned a nil into a non-nil error would break the idiomatic Go check for a nil return.
The print family has three shapes. tracerr.Print prints the message and the stack trace if there is one. tracerr.PrintSource adds the source code of the frames. And the colour variant, PrintSourceColor, is what the README recommends, describing it as much more useful, because the traced line is highlighted among the surrounding lines rather than being a number in a list.
There is one constraint that governs all of them, and the README puts it as a note: the stack trace is printed only if err is of type tracerr.Error, otherwise just the error text is shown. In other words, tracerr does not panic or fail on a foreign error, it degrades to printing what the error already says. That makes it safe to call PrintSource on any error value in a catch-all handler, which is the situation where you most want the extra context and least want another failure.
Source fragments: how many lines, and before or after
The interesting parameter is how much source to show. By default six lines of code are displayed for each frame, and the README shows the form that changes the count:
tracerr.PrintSource(err, 9)There is a second form that sets the number of lines before and after the traced line instead, which is the more precise control:
tracerr.PrintSource(err, 5, 2)So the default is a symmetric window around the failing line, the single argument form sets the total, and the two argument form sets the two halves of the window separately. A call site that needs a wide context uses the first, and a call site that needs to see what comes after the failure, for instance the return statement that turned an error into a wrapped one, uses the second.
Every print function has the same pair of variants with colour, so PrintSourceColor, PrintSourceColor with a count, and PrintSourceColor with a before and after count are all available, and the pattern is consistent enough that choosing between them is a one line decision.
The dependency on source availability is worth understanding. The library reads the source file of each frame to print the surrounding lines, which means the file has to exist on the machine doing the printing, and it has to be the file that produced the running code. When the program runs from a container image whose source is not in the final layer, or from a build that stripped the source, the frame list is still there but the fragments are not. The README does not describe any fallback for that case, so a deployment that wants the source in its logs needs to ship the source.
Sprinting instead of printing, and reaching the frames yourself
Not every error report goes to standard output. The package has a matching set of Sprint functions that return the rendered text instead of printing it: tracerr.Sprint for the message and stack, and tracerr.SprintSource for the version with source lines, again with the count and the before and after forms.
text := tracerr.SprintSource(err, 5, 2)That is the form to use when the report is going into a structured log, a JSON field, or a test assertion, since a test that compares the rendered output is far easier to write than one that captures standard output.
The library also exposes the raw data. tracerr.StackTrace(err) returns the frames, and the README notes that the stack trace will be empty if err is not an instance of tracerr.Error. When the error is of that type, the frames are also reachable as a method, err.StackTrace(), which is the form to use once you have type asserted.
The same pattern applies to unwrapping. tracerr.Unwrap(err) gives the original error back, and the README specifies the behaviour precisely: the unwrapped error will be nil if err is nil, and it will be the same error if err is not an instance of tracerr.Error. So unwrapping a foreign error gives that error back unchanged rather than nil, and unwrapping a nil gives nil. For the method form, err.Unwrap() is available on the tracerr.Error type.
That combination, an unwrap that returns the original error and a stack that is attached alongside rather than replacing anything, is what makes tracerr compatible with the standard library's error inspection. The original error is still there to be compared with errors.Is, or matched with errors.As against your own error types, and the stack is additional information layered on top.
What it costs, according to the benchmark in the README
The README publishes its own benchmark for creating an error with a stack of different depths, and it is worth reading rather than assuming:
GOMAXPROCS=1 go test -bench=. -benchmem
goos: linux
goarch: amd64
pkg: github.com/ztrue/tracerr
cpu: Intel(R) Core(TM) i7-14700KF
BenchmarkNew/5           4500129               267.1 ns/op           256 B/op          4 allocs/op
BenchmarkNew/10          3325456               359.5 ns/op           256 B/op          4 allocs/op
BenchmarkNew/20          1000000              1001 ns/op             576 B/op          5 allocs/op
BenchmarkNew/40           538689              2171 ns/op            1216 B/op          6 allocs/op
The pattern is clear. Capturing a five frame stack costs about 267 nanoseconds and four allocations, and the cost grows with depth: ten frames is still four allocations and 256 bytes, twenty frames add an allocation and reach 576 bytes, and forty frames cost about 2.2 microseconds and six allocations.
Two things follow. First, the cost is in capturing the stack, not in printing it, since the benchmark measures error creation, and printing happens on the failure path where a microsecond is irrelevant. Second, the growth with depth is what tells you where the library is meant to sit. Wrapping at a single point near the failure, where the stack is shallow, is cheap. Wrapping at every layer of a deep call chain, so that the stack grows with the depth of the chain, multiplies both the time and the allocation. The API is designed for the first pattern, and the benchmark makes the second one visible before you ship it.
For comparison, the Makefile in the repository has a bench target that runs the same command, along with a test target, a coverage target, a lint target that runs go fmt, go vet and golint, and a doc target that serves godoc on port 6060.
Maintenance, licence and where a stack trace wrapper is the wrong answer
The licence is MIT, with the LICENSE file at the root and a CHANGELOG.md alongside it. The project is small, and the last push to the repository was on 2026-04-02, so the honest description is that the code has not changed recently rather than that it is actively developed. Nothing in the README suggests a release cadence, and the repository publishes no GitHub releases, so the module is consumed at whatever commit you pin.
The place where tracerr is the wrong tool is the place where the standard library already does the job. Since Go 1.13, an error can be wrapped with the %w verb and inspected with errors.Is and errors.As, and a project that only needs to know which error it is, and which package it came from, does not need a stack at all. Wrapping every error with a stack in that situation adds allocations for information the code will never use.
The second wrong case is a program that already logs with structure. A logger that records a function, a file and a line at the call site, as slog does, has the information tracerr adds, in a machine readable form, without a separate rendering step. tracerr is built for the human reading a log file, and for a service that ingests its own logs, the structured form is better.
The third wrong case is concurrency and goroutine identity. The README describes capturing a stack, and a Go stack trace is per goroutine, so what you get is the call chain of the goroutine that failed. That is usually what you want, and it also means the trace says nothing about what the other goroutines in the program were doing, which is frequently the actual question when a program hangs rather than fails.
There is also a design constraint in the API that is easy to miss. Because the stack is attached at the point of the wrap, the frames are the path from the wrap to the top of the goroutine, not the path from the origin of the failure to the wrap. Wrapping once, close to where the failure was detected, gives a trace that points at the right place. Wrapping at every layer gives a trace whose topmost frames are all your own wrappers, and the useful part is buried. tracerr is at its best used once per failure, not as a general error decoration habit.
Editorial conclusion
Adopt tracerr if your team debugs Go programs from logs and stack traces alone, since the source fragment is the piece those outputs leave out, and if the allocation cost of capturing a stack is acceptable at your error rate. Do not adopt it in a hot path where errors are returned routinely rather than exceptionally, and do not expect it to replace the standard wrapping verbs, since it captures the stack at the point of the wrap rather than at the origin of the failure. Verify first by wrapping an error from a third party package and printing it with PrintSourceColor, because the source lines only appear for frames whose files the binary can still read.
Frequently asked questions
How do I add a stack trace to an error in Go with tracerr?
Wrap the error with tracerr.Wrap(err), which returns an error carrying a captured stack. The README notes that if err is nil the result is still nil with no stack trace added, so it is safe to call on a value that might be nil.
How do I print the source code around the line that failed?
Use tracerr.PrintSource(err) to add the source lines, tracerr.PrintSource(err, 9) to change how many lines are shown from the default of six, or tracerr.PrintSource(err, 5, 2) to set the number of lines before and after the traced line. The colour variants PrintSourceColor take the same arguments.
What happens if I pass tracerr an error that is not a tracerr.Error?
It degrades instead of failing. The stack trace is printed only if the error is of type tracerr.Error, and otherwise only the error text is shown. The same applies to Unwrap, which returns the same error back when it is not a tracerr.Error.
Can I get the error text as a string instead of printing it?
Yes. tracerr.Sprint and tracerr.SprintSource return the rendered text rather than printing it, and the SprintSource variants accept the same line count arguments, for example tracerr.SprintSource(err, 5, 2), which is what you would use to put the report into a log field or a test assertion.
How much does capturing a stack trace cost in tracerr?
The README publishes a benchmark of error creation: about 267 ns/op and 4 allocs/op for a five frame stack, 359.5 ns/op and 4 allocs for ten frames, 1001 ns/op and 5 allocs for twenty frames, and 2171 ns/op and 6 allocs for forty frames, on linux/amd64.
Does tracerr have any dependencies?
No. The go.mod file contains only the module declaration for github.com/ztrue/tracerr, with no require block, so the package pulls in nothing else. The build and test commands live in the Makefile, with make test, make coverage, make bench, make lint and make doc targets.
Official sources
Add this badge to your README
If you maintain this project, the badge below links readers to this analysis and shows its maintenance status from the daily GitHub snapshot. Paste the markdown into your README; add ?metric=license or ?metric=stars to the image URL for a different field.

[](https://hysenlabs.com/projects/ztrue-tracerr)Star history chart for your README
[](https://hysenlabs.com/projects/ztrue-tracerr)Was this useful?