NeoHtop 1.3: a Tauri and Svelte desktop process monitor with GPU readings, port search and a menu bar companion
💪🏻 Blazing-fast system monitoring for your desktop (built with Rust, Tauri & Svelte)
At a glance
- What is it?
- NeoHtop is an MIT-licensed graphical system monitor for macOS, Linux and Windows, built with Rust, Tauri and Svelte. Version 1.3 adds process trees, GPU diagnostics, port lookup and a menu bar view, but it is a live viewer with about two minutes of chart memory, not a long-term monitoring tool.
- Who is it for?
- NeoHtop suits a desktop user on macOS, Linux or Windows who wants a graphical, themed alternative to a terminal process viewer, with process families, GPU readings and quick port lookup in one window and a compact view in the menu bar or tray. It does not suit anyone who needs history beyond about two minutes, alerting, or a terminal tool for servers without a desktop.
- Can I use it commercially?
- Yes. MIT is a permissive licence: you can use, modify and sell software built on it, as long as you keep its copyright and licence notices.
- Is it still maintained?
- Yes. The repository last received commits 15 days ago.
- What is it written in?
- Mainly Svelte, according to GitHub's language statistics.
Answers come from the project's GitHub data, last synced on November 14, 2026, and from our analysis. They are not legal advice.
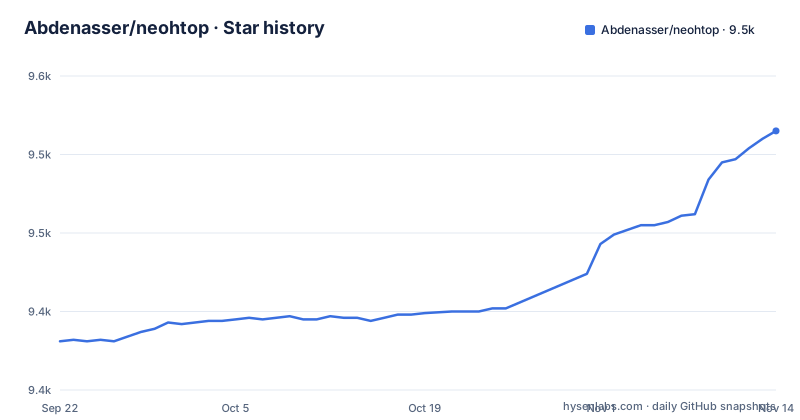
Star history
- Abdenasser/neohtop9,515 ★ · +134
| Repository | 2026-09-22 | 2026-11-14 |
|---|---|---|
| Abdenasser/neohtop | 9.4k | 9.5k |
134 Stars in the last 53 days, measured from the daily GitHub snapshot. Compare with other projects
Editorial analysis
Process families instead of a flat list
NeoHtop's main table is a process list you can sort, filter by usage, and pin entries in, with an inspector for any single process. Version 1.3 adds a Tree view: switching to Tree lets you expand a process family and see the combined CPU and RAM of the parent and its children. That answers a question a flat list makes awkward, namely how much an application with many helper processes is really using. Search keeps matching children in context, so filtering for one process does not strip away the family it belongs to. Each row shows a native app icon when the operating system can provide one, and a ghost icon when it cannot, so on systems that expose fewer icons you will see more ghosts and rely on names instead. The inspector is the deeper view and is reachable from the table, from charts and from the menu bar companion.
Typing :3000 finds the process that owns a port
The search box understands port queries. Typing :3000 or port:443 finds the process holding that port, which is the common case of a development server that refuses to start because something else is already bound. A bare number still finds a process by PID, so the colon or the port: prefix is what switches the search into port mode. Socket scans run only when you ask for them in this way, rather than continuously in the background, which keeps the normal refresh loop from paying for port lookups you are not using. The trade-off is that port ownership is not a live column in the table; it is answered on demand. If you want to watch a port change hands over time, you will be repeating the search, not observing a stream.
GPU readings come from what the driver reports
Version 1.3 puts the graphics card next to CPU, RAM, storage, system and network readings. Opening Graphics from the GPU card shows utilization, memory and diagnostics, and on machines with more than one GPU you select an adapter. The diagnostics are described as driver-reported, which sets the limit: NeoHtop shows what the graphics driver exposes, so the depth of detail depends on your card and driver rather than on NeoHtop. Every resource card opens a deeper view: CPU cores, memory breakdowns, graphics adapters, mounted volumes, system identity and network interfaces. The Network view lets you search interfaces or include inactive ones when you need to see traffic on a particular adapter. The CPU, memory, GPU and network charts can be inspected with the pointer or the keyboard, which is how you trace a sudden spike back to the moment it happened.
Two minutes of chart history, held only in memory
The charts keep roughly two minutes of history, in memory. That is the most important limit for anyone weighing NeoHtop against a monitoring stack. A spike that happened ten minutes ago is gone from the charts, and nothing survives closing the app, so NeoHtop cannot answer what your machine was doing overnight or during yesterday's build. It is a tool for watching the present and the very recent past. What it does offer is control over that window: you can pause, inspect and resume from the app bar or from the companion, and both windows share the same sample and monitoring state, so pausing in one pauses the other. The refresh interval is set in Settings, under General, which changes how often samples are taken within that short window. For longer records or alerts you will need a different tool alongside it.
The menu bar companion shares state with the main window
NeoHtop 1.3 adds a compact companion in the macOS menu bar, also available through the system tray on supported desktops. It shows CPU, memory, GPU, network and free storage, plus your five busiest processes with native icons, and one click takes you from a process to its inspector. Pause, sampling interval and theme are shared with the main window. Monitoring can optionally continue after you close the main window, which is what makes the companion useful as a quick check between tasks. The qualifier on Linux and Windows is supported desktops: the tray route depends on your desktop providing a system tray, so on a desktop without one the companion is not available and you are left with the full window. Leaving monitoring running after closing the main window also means the sampling keeps going in the background until you turn it off.
Packages per architecture, with checksums and a build manifest
NeoHtop does not install from a package manager command in its README; official packages are published on GitHub Releases with SHA-256 checksums and a build manifest. For v1.3.0 the downloads are a DMG for Apple Silicon and a separate DMG for Intel Macs, an x64 setup executable for Windows, and deb, rpm and AppImage packages for Linux on both x86_64 and ARM64. No Windows ARM64 package appears in the v1.3.0 list, so Windows on ARM users have no matching download there. Pick the DMG that matches your Mac's processor, since the two files are separate. The checksums give you a way to confirm the file you downloaded matches the release. The repository also contains a telemetry/ directory; if you run NeoHtop on a machine where outbound data is a concern, read what that directory contains before deploying, rather than relying on the front page's short description of the app as free, local and open source.
Svelte 5 on Tauri 2, with 24 rebuilt themes
NeoHtop is a Tauri app: the Rust side lives in src-tauri/ with its own Cargo.toml, and the interface is Svelte 5 with SvelteKit, the static adapter and Vite. The Tauri JavaScript API and the os and shell plugins are at version 2. For contributors, package.json defines dev, build, check and format scripts, and the format script runs both Prettier and cargo fmt against src-tauri/Cargo.toml, so a contribution touches two toolchains. The build script also runs a check on the shadcn CSS, and SHADCN_MIGRATION.md records the move to shadcn-svelte controls. That migration is behind the themes: all 24 themes were rebuilt around consistent shadcn-svelte controls and readable tokens, with a searchable gallery. Catppuccin is the default, and the palettes span dark, light, colorful, retro and accessible options, with the same theme carried across app windows. A .nvmrc file pins the Node version for local builds.
A seventeen-month gap before version 1.3
The release history has an uneven rhythm. v1.1.3 shipped on 2025-05-31 and v1.2.0 on 2025-06-02, then nothing until v1.3.0 on 2026-10-29. The last push to main was on 2026-10-30, so the project is under active development again, and package.json reads 1.3.0. The consequence for users is that 1.3 is a large step after a long pause, introducing the Tree view, GPU readings, port search, the companion and the rebuilt theme system in a single release. Read CHANGELOG.md before updating, and keep the previous package around if a workflow you rely on changes shape. The project is MIT licensed.
Editorial conclusion
NeoHtop suits a desktop user on macOS, Linux or Windows who wants a graphical, themed alternative to a terminal process viewer, with process families, GPU readings and quick port lookup in one window and a compact view in the menu bar or tray. It does not suit anyone who needs history beyond about two minutes, alerting, or a terminal tool for servers without a desktop. Before installing, check that a package exists for your platform and architecture, verify the download against the published SHA-256 checksums, and look at the telemetry/ directory in the repository if you run it on a controlled machine.
Frequently asked questions
What is htop used for, and what does NeoHtop add?
NeoHtop is a graphical system monitor for macOS, Linux and Windows for exploring processes and system resources. It adds process family trees, GPU readings, port search such as :3000, and a menu bar companion.
Does NeoHtop run on Linux?
Yes. NeoHtop v1.3.0 ships deb, rpm and AppImage packages for Linux on both x86_64 and ARM64 through GitHub Releases, with SHA-256 checksums.
How long does NeoHtop keep chart history?
NeoHtop's charts keep roughly two minutes of history in memory. You can pause, inspect and resume from the app bar or the menu bar companion.
Official sources
Add this badge to your README
If you maintain this project, the badge below links readers to this analysis and shows its maintenance status from the daily GitHub snapshot. Paste the markdown into your README; add ?metric=license or ?metric=stars to the image URL for a different field.

[](https://hysenlabs.com/projects/abdenasser-neohtop)Star history chart for your README
[](https://hysenlabs.com/projects/abdenasser-neohtop)Was this useful?