S2: a canvas pivot table where you configure dimensions, not DOM
⚡️ A practical visualization library for tabular analysis.
At a glance
- What is it?
- S2 from AntV renders multi dimensional cross analysis tables on canvas, with a core library plus React, Vue 3 and SSR packages. The getting started path is a data config object, a container div and two lines of options, and the default branch is next.
- Who is it for?
- S2 fits teams building an analytics screen where rows and columns are decided at runtime by user filters, since the pivot layout is described as data rather than markup and the same core serves React, Vue 3 and server rendering. Skip it for an ordinary data grid, because a canvas table may not expose cell nodes directly to testing tools, accessibility trees or browser find.
- Can I use it commercially?
- Yes. MIT is a permissive licence: you can use, modify and sell software built on it, as long as you keep its copyright and licence notices.
- Is it still maintained?
- Yes. The repository last received commits 55 days ago.
- What is it written in?
- Mainly TypeScript, according to GitHub's language statistics.
Answers come from the project's GitHub data, last synced on November 7, 2026, and from our analysis. They are not legal advice.
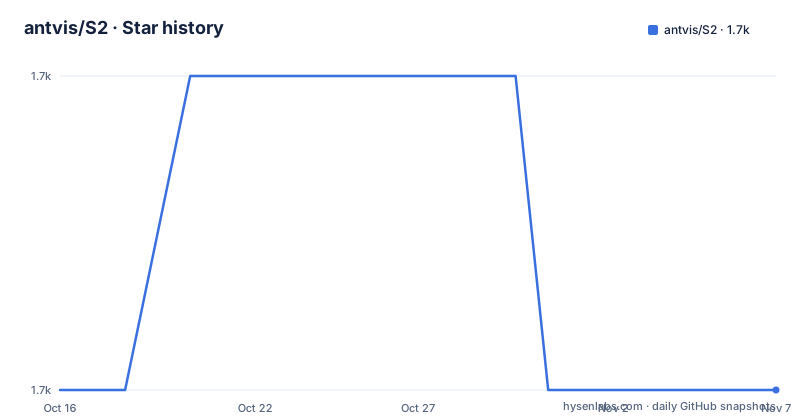
Star history
- antvis/S21,697 ★ · +0
| Repository | 2026-10-16 | 2026-11-07 |
|---|---|---|
| antvis/S2 | 1.7k | 1.7k |
0 Stars in the last 22 days, measured from the daily GitHub snapshot. Compare with other projects
Editorial analysis
The table is a canvas, so the DOM is not there to query
S2 describes itself as a pure data driven multi dimensional cross analysis table solution, and repository topics name canvas, pivot grid, spreadsheet and editable table among others. That single word, canvas, decides most of the trade-offs. A DOM based grid gives you queryable nodes, so a test can find a cell and a screen reader can read a row. A canvas gives you raw drawing throughput and a layout engine free of the overhead of thousands of elements, which is what makes drill down feel instant in a report with wide dimensions. The README claims support for rendering millions of data points in under eight seconds, and sub second rendering for drill downs; those are the project's own numbers and no methodology accompanies them. Budget your own verification time accordingly.
Install, point at a div, hand it a data config
Install the core package with whichever package manager you already use:
npm install @antv/s2 --savepnpm add @antv/s2Then prepare a container and import the API object you need. The example uses PivotSheet, fetches a data config, constructs the sheet against the container and renders:
<div id="container"></div>import { PivotSheet } from '@antv/s2';
async function bootstrap() {
const container = document.getElementById('container');
const s2DataConfig = await fetch('https://assets.antv.antgroup.com/s2/en-data-config.json')
.then(r => r.json())
const s2 = new PivotSheet(container, s2DataConfig, {
width: 600,
height: 400,
});
await s2.render();
}
bootstrap()Three arguments carry the whole story: the DOM node, the data config, and the options. Height and width are explicit numbers here, which tells you the component owns its own sizing rather than inheriting it from the page. Everything about which dimensions appear on rows, columns and values lives in that data config object, which is also what you would fetch from your own backend in a real application.
Five published packages cover core, framework bindings and SSR
The repository is a monorepo and the README's package table matches its packages directory. @antv/s2 is the core. @antv/s2-react wraps it for React, and @antv/s2-react-components holds ready made React components for common analysis scenarios. @antv/s2-vue is the Vue 3 binding, and @antv/s2-ssr covers server side rendering. The distinction between s2-react and s2-react-components matters in practice: the first is the component, the second is a set of batteries included scenarios, and taking the second pulls more opinionated behaviour into your app than a plain pivot sheet. The repository enforces one package manager for contributors rather than users: the root package.json sets a preinstall script running only-allow pnpm, with a bootstrap script calling pnpm install.
Layout, interaction, style and data processing are the extension points
The README's feature list names four kinds of custom extension, and the list is a better description of the API surface than the words library or components would be. Layout extension is how you change how the pivot grid arranges rows and columns. Interaction extension covers behaviours beyond the built-ins. Style extension controls appearance, and data processing extension sits closest to the analytics itself. Alongside those, the README lists the interactions that work out of the box: selection in single, multi and range forms, freezing, resizing, and custom interactive behaviours. Frozen headers and frozen leading columns are the feature that separates this from a plain table once rows start scrolling.
Releases land per package, and the default branch is next
The versioning detail matters for upgrades. The recent releases are scoped to one package rather than the whole project, for example @antv/s2-v2.7.2 published on 2026-06-10, preceded by two alpha builds of the same version on 2026-06-09 and 2026-06-03. So you are pinning a package version, not a project release, and a stable tag can sit next to alphas for the same number. The default branch is next, which is where the README lives and where the packages directory points, and the last push was on 2026-09-14. If you vendor a build rather than taking the registry package, be aware you are taking development branch output.
Against a DOM grid or a spreadsheet component
The realistic alternative depends on which problem you are solving. For a fixed column list with server side paging, an ordinary table component with virtualised rows is less machinery and keeps your tests and accessibility tooling intact. For a report where the user slices rows and columns by choosing dimensions, S2's pivot layout is the reason to use it, because the alternative is building a pivot engine on top of a grid library. A full spreadsheet component goes further again, offering editing and formulas S2 does not attempt. The difference in approach is scope: S2 optimises the cross analysis view and leaves general grid work, and any cell editing beyond what its editable table topic implies, to you.
Editorial conclusion
S2 fits teams building an analytics screen where rows and columns are decided at runtime by user filters, since the pivot layout is described as data rather than markup and the same core serves React, Vue 3 and server rendering. Skip it for an ordinary data grid, because a canvas table may not expose cell nodes directly to testing tools, accessibility trees or browser find. Before adopting, render your own largest dataset in a browser you must support, since the README's figures of millions of data points in under eight seconds and sub second drill downs are the project's own claims with no methodology given, and check the browser compatibility table yourself because it lists per browser with no version floor stated. The last push was on 2026-09-14, the newest published package is @antv/s2-v2.7.2 from 2026-06-10, and the default branch is next.
Frequently asked questions
How do I install S2 and render my first pivot table?
Install the core package with npm, yarn or pnpm, add a container div to the page, import PivotSheet from '@antv/s2', then construct it with the container, a data config and options such as width and height, and call render.
Does S2 work with React and Vue?
Yes. The repository publishes @antv/s2-react, @antv/s2-react-components for ready made analysis scenarios, @antv/s2-vue for Vue 3, and @antv/s2-ssr, all alongside the @antv/s2 core package.
How large a dataset can S2 render?
The README states S2 supports rendering millions of data points in under eight seconds, with sub second rendering for drill downs. These are the project's own figures and the README gives no methodology behind them.
Official sources
Add this badge to your README
If you maintain this project, the badge below links readers to this analysis and shows its maintenance status from the daily GitHub snapshot. Paste the markdown into your README; add ?metric=license or ?metric=stars to the image URL for a different field.

[](https://hysenlabs.com/projects/antvis-s2)Star history chart for your README
[](https://hysenlabs.com/projects/antvis-s2)Was this useful?