github-readme-activity-graph: an image endpoint whose deployment has died twice
A dynamically generated activity graph to show your GitHub activities of last 31 days.
At a glance
- What is it?
- A service that renders your last 31 days of GitHub activity as a graph you embed in your profile readme, configured entirely by URL parameters, with a documentation notice recording that its first two hosts shut down and a token requirement that makes the public instance a shared secret.
- Who is it for?
- Adopt the self-hosted route if you want a contribution graph in your profile readme, because the whole thing is one image URL with about twenty parameters and the project documents deployment on two different hosts, which takes an afternoon.
- Can I use it commercially?
- Yes. MIT is a permissive licence: you can use, modify and sell software built on it, as long as you keep its copyright and licence notices.
- Is it still maintained?
- Yes. The repository last received commits 174 days ago.
- What is it written in?
- Mainly TypeScript, according to GitHub's language statistics.
Answers come from the project's GitHub data, last synced on November 7, 2026, and from our analysis. They are not legal advice.
Star history
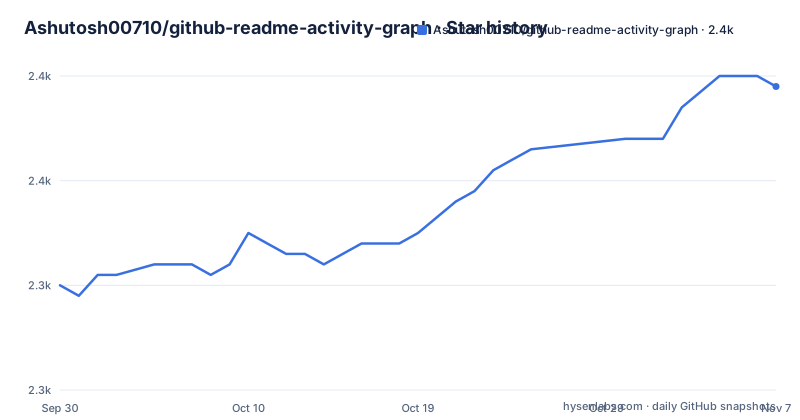
- Ashutosh00710/github-readme-activity-graph2,359 ★ · +19
| Repository | 2026-09-30 | 2026-11-07 |
|---|---|---|
| Ashutosh00710/github-readme-activity-graph | 2.3k | 2.4k |
19 Stars in the last 38 days, measured from the daily GitHub snapshot. Compare with other projects
Editorial analysis
The deployment notice is the most useful paragraph in the readme
Read the notice near the top before anything else, because it tells you what kind of project this is. The canonical deployment has moved to one host, and two earlier deployments are gone, with the reason given for each: the first because the platform's free tier was discontinued, the second because that platform shut down in early 2025. The project links the issue where the background is discussed, which is the right thing to do and unusually good practice. Now read what that means for you as a user. A readme badge is an image reference, and an image reference has no error state: if the host disappears, the image simply does not render, and in a profile readme nobody notices for months. So a service whose artefact is a badge in a readme has a failure mode that is invisible by construction, and this project has now lived through that failure twice. The response was to move and to document the move, which is the correct response and the reason the readme is worth reading. The artefact you embed looks like this:
[](https://github.com/ashutosh00710/github-readme-activity-graph)A username parameter, an image path, and a link back to the project. There is no script, no iframe and no client-side code, which is why the failure mode is invisible when the host disappears. The response you should take is different: if you embed this, you should decide now whether you are depending on somebody else's uptime, because the evidence in this repository is that two somebodies' uptime has already ended.
The token requirement, and why it shapes the self-hosting decision
The environment example in this repository is one line, and it is a personal access token for the hosting platform. That single requirement explains the deployment section, which offers instructions for running your own instance on two different platforms. Fetching a user's activity requires authenticated access to that user's data, and the environment file shows where the token comes from. So there are two deployments of the same code and they are not equivalent in trust. The hosted one is a service you do not run, using a token you do not control, serving a request that identifies you by username. The self-hosted one is a process on your own account, using your own token, serving the same request to whoever asks. For a public profile readme, the first is a small convenience and the second is a small amount of work. The decision is not really about effort, it is about what you are handing over. A personal access token scoped to read your activity is not the most sensitive credential in your account, and it is still a credential, and handing it to a third-party instance means that instance, or anyone who compromises it, can act as you against that scope. The readme does not discuss this trade, which is a gap rather than a fault, and the self-hosting instructions exist partly for exactly this reason. If you are putting this in a public readme, decide which of the two you are comfortable with before you paste the URL.
Twenty URL parameters, and a documented range you should not widen
The customization table is the actual specification of the service, and it is well made. Colours are given as hex codes without a hash symbol, and there are eight of them covering the card background, the border, the title, the text, the line, the points and the area fill. Three boolean flags turn features on and off: the area fill under the graph, a transparent border, and an empty title, with defaults stated for each. Then there are the parameters that are not cosmetic. There is a border radius bounded to a small range, a height bounded between two hundred and six hundred, a day count documented as between one and ninety with an explicit recommendation to stay below forty, and a pair of date parameters for an explicit window in a stated format. Three details are worth pausing on. The recommended day limit is separate from the allowed limit, and the reason is almost certainly the cost of fetching a long history rather than the cost of drawing a wide graph, which means a longer window is a slower badge for everyone who loads your profile, not just for you. The explicit date range means the graph is not relative to today, so a profile readme can show a fixed window that will not move. And the note about encoding spaces in a custom title tells you these are query string values assembled by hand, not a configuration object, which is a fair constraint for a badge but does mean any value with a space or an ampersand needs care.
Eleven named themes, a default with a nickname, and a separate themes file
The theme table is the part of this project that tells you what it is for. There are eleven entries in the readme, and the list is a partial one, with a link to a separate themes file in the repository for the rest. The names are the point. There is a default, and it has a nickname rather than a name, which is a small piece of personality in a parameter list. Then there is a pair for a JavaScript framework's brand colours in light and dark, a pair for the hosting platform's own colours in a compact variant, an editor theme, a licence-inspired theme, a dense low-contrast variant, a second framework, a second dark theme, and a high-contrast variant. That is a curated list, not a generated one, and the curation is the work. A theme here is a bundle of the colour parameters plus whatever the rendering library needs, so adding one is a matter of defining those values and previewing the result, which is why the table includes a preview image for every entry. Two design points fall out of that. The presence of a high-contrast variant and dark variants is an accessibility consideration that a badge generator can easily ignore, since the badge is usually small and often decorative. And a compact variant suggests the author has thought about the badge appearing in a dense list of repository links, where a 600-pixel-tall graph is out of the question. If you are choosing a theme for a profile readme, pick the one that matches the surrounding page rather than the one with the most contrast, and check it at the height your readme will actually render.
The dependency list mixes server code, rendering, a charting library and the test framework
Look at the dependencies as a description of how the thing works, because the list is not curated the way a library's would be. The server side is an Express application with a cross-origin middleware and a body parser, and the build is a TypeScript compile to a directory that a node entry point runs. The data fetching is a single HTTP client. Then there are the unexpected ones. A charting library is a direct dependency, at a caret range, which means the graph you see is drawn by a charting package rather than by hand-written markup, and the graph is therefore produced as markup and then serialised. Two date-related packages are there, one of which is a widely used date library, which is a reasonable choice for a service that has to accept date parameters and compute windows. A MIME database and its type mapping are also direct dependencies, which is what you would expect from a service that has to return the right content type for an image, and that detail is worth noting because a badge served with the wrong content type will not render. And then the tooling is all in the dependency list rather than the development one: the test runner, the HTTP test client, the type definitions for most of the server packages, a watcher, a TypeScript runtime and the compiler itself. So the manifest does not distinguish what the service needs to run from what is needed to develop it, which is untidy and occasionally the reason a deploy pulls more than it should.
Deployment targets two platforms and the readme admits the old ones are gone
The deployment section is a practical strength, and it is the reason this project is worth using at all. It documents deploying your own instance, with a separate set of steps for each of two platforms, and it describes more than one method for one of them. In the repository you can see the residue of both: a configuration directory and a launch script for one, a JSON configuration file and a provider configuration for the other, and an application manifest and a Nix file at the root. The presence of all of those is what makes the two-platform claim credible rather than aspirational. A project that says deploy it yourself and then only provides a button for one host is not really offering self-hosting; this one has the configuration committed for both, and a contributor can therefore test either route without reconstructing it. Two caveats. Both platforms are developer-oriented hosts with their own pricing and lifecycle decisions, and this project has just demonstrated what happens when one of them changes its terms: a badge in thousands of readmes went dead with no warning and no error. And the self-hosting instructions do not cover the token's scope, which is the part you will want to get right. Treat the platform choice as a decision you will have to revisit, and the configuration files in the repository as the starting point for doing it properly.
Editorial conclusion
Adopt the self-hosted route if you want a contribution graph in your profile readme, because the whole thing is one image URL with about twenty parameters and the project documents deployment on two different hosts, which takes an afternoon. Do not depend on the hosted instance, because the readme records that its first two deployments are gone after their providers discontinued, and a readme badge pointing at a dead host is a broken image on your profile rather than an error you can see. Two things to check before you embed it. Read the environment example, which asks for a personal access token, and decide whether you are willing to give a third-party service a token that can read your private repositories, or whether the self-hosted route with your own token is the only acceptable answer. And check the days parameter's documented range before you widen it, because the service recommends staying below forty while allowing up to ninety, and the reason is a fetch against the platform's API rather than a rendering limit.
Frequently asked questions
How do I add the GitHub activity graph to my profile readme?
Paste the image markdown with the graph URL and your username as a query parameter. Themes are added with a theme parameter, and the readme has a separate attention section and a customization table covering colours, booleans, size and the day range.
Where is the current deployment of github-readme-activity-graph?
The readme states the canonical deployment is now on one host, and that previous deployments on two other platforms are no longer reachable, one because that platform's free tier was discontinued and one because the platform shut down in early 2025. The background is linked to an issue.
Can I self-host github-readme-activity-graph?
Yes, the readme documents deploying your own instance with separate steps for two platforms, including two methods for one of them. The repository contains configuration and launch files for both, plus a replit directory and a provider configuration file.
What environment variables does the activity graph service need?
The example environment file contains one variable, a personal access token for the hosting platform. That token is what lets the service fetch a user's activity, and it is the reason the readme offers self-hosting with your own token as well as the hosted instance.
How many days can the github-readme-activity-graph show?
The days parameter is documented as accepting a number between one and ninety, with a recommendation to stay below forty. There are also from and to parameters for an explicit date window in a year-month-day format.
Official sources
Add this badge to your README
If you maintain this project, the badge below links readers to this analysis and shows its maintenance status from the daily GitHub snapshot. Paste the markdown into your README; add ?metric=license or ?metric=stars to the image URL for a different field.

[](https://hysenlabs.com/projects/ashutosh00710-github-readme-activity-graph)Star history chart for your README
[](https://hysenlabs.com/projects/ashutosh00710-github-readme-activity-graph)Was this useful?