github-action-benchmark turns benchmark output into a trend chart
GitHub Action for continuous benchmarking to keep performance
At a glance
- What is it?
- This GitHub Action reads whatever file your benchmark tool produced, normalises the results into name, unit and value entries, and stores them on a gh-pages branch so every push adds a point to a chart. It covers ten named benchmark tools plus a custom mode, and it can fail the workflow when a metric regresses past a threshold.
- Who is it for?
- Adopt github-action-benchmark if you already run benchmarks in CI and want the results to persist across commits with regression alerting, since it saves you building storage and comparison yourself. Do not adopt it if your benchmarks are noisy enough that a threshold failure would be noise, since the alert is only as good as the stability of the numbers behind it.
- Can I use it commercially?
- Yes. MIT is a permissive licence: you can use, modify and sell software built on it, as long as you keep its copyright and licence notices.
- Is it still maintained?
- Yes. The repository last received commits 54 days ago.
- What is it written in?
- Mainly TypeScript, according to GitHub's language statistics.
Answers come from the project's GitHub data, last synced on November 7, 2026, and from our analysis. They are not legal advice.
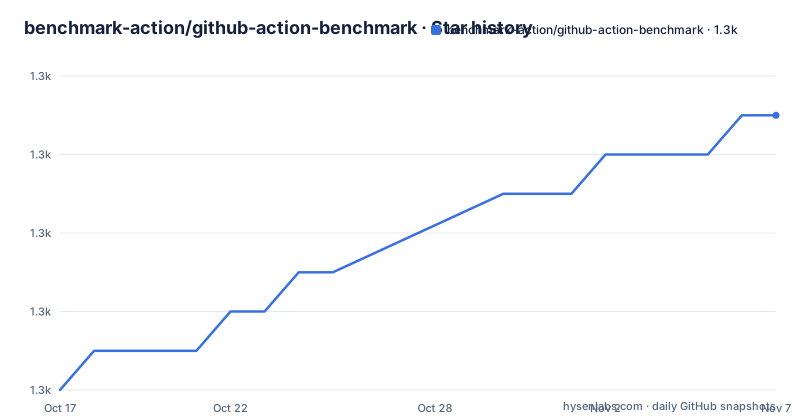
Star history
- benchmark-action/github-action-benchmark1,271 ★ · +7
| Repository | 2026-10-17 | 2026-11-07 |
|---|---|---|
| benchmark-action/github-action-benchmark | 1.3k | 1.3k |
7 Stars in the last 21 days, measured from the daily GitHub snapshot. Compare with other projects
Editorial analysis
The unit of work is an output file
The action does not run your benchmarks. It takes a file containing benchmark output, collects the data from it, and monitors the results on the GitHub Actions workflow.
That split is the design. Whatever tool produced the file stays your business, and the action's job is to read the numbers out of it, store them, and compare them against history.
Two outputs follow from that. Results are written to a gh-pages branch, and a chart view is provided from the GitHub pages of your project. And the action can detect regressions by comparing results, raising an alert through a commit comment or a workflow failure when a result gets worse than the previous one beyond a specified threshold.
The chart carries more than a line. Hovering a data point shows a tooltip with the commit hash, the commit message, the date and committer, and the benchmark value, and clicking a point opens the commit page on the repository. There is a download button at the bottom of the page for the results as JSON.
That provenance detail is the reason to use this rather than a local benchmark comparison in CI. A number on a chart with a commit hash attached to each point can be traced back to the change that caused it.
Eleven tools, and how the parsing differs
The supported tools are listed as `cargo bench` for Rust, `go test -bench` for Go, benchmark.js for JavaScript and TypeScript, pytest-benchmark for Python, the Google Benchmark Framework for C++, Catch2 for C++, BenchmarkTools.jl for Julia, Benchmark.Net for .Net, benchmarkluau for Luau and JMH for Java.
Alongside them there are custom benchmarks using `customBiggerIsBetter` or `customSmallerIsBetter`, and the direction is defined by the tool name: which way is better for your benchmark.
Multiple languages in the same repository are supported for polyglot projects, which is the case that makes the custom tools more useful than they first look. If your benchmark is something nobody has ever written an adapter for, you produce the JSON yourself.
The repository's example projects show the range: `examples/rust`, `examples/go`, `examples/benchmarkjs`, `examples/pytest`, `examples/cpp`, `examples/catch2`, `examples/catch2_v2`, `examples/criterion-rs`, `examples/julia`, `examples/java` and `examples/benchmarkdotnet`.
Note that two of those, `catch2_v2` and `criterion-rs`, are not in the README's table of live workflows. That is harmless, since an example directory without a running workflow is just extra material, but it is a reminder that the README's table is a snapshot of what is exercised in CI rather than the complete list of what parses.
The minimal workflow is short enough to read as a template. It checks out the code, sets up the language, runs the benchmark writing output to a file, and hands that file to the action. The language-specific parts are what differ between them.
The custom format is three required fields
For custom benchmarks the action wants a JSON array where every entry has `name`, `unit` and `value`. Two optional properties exist on top: `range` for the result's variance and `extra` for any additional information useful for context.
[
    {
        "name": "My Custom Smaller Is Better Benchmark - CPU Load",
        "unit": "Percent",
        "value": 50
    },
    {
        "name": "My Custom Smaller Is Better Benchmark - Memory Used",
        "unit": "Megabytes",
        "value": 100,
        "range": "3",
        "extra": "Value for Tooltip: 25\nOptional Num #2: 100\nAnything Else!"
    }
]
The `extra` field is described as arbitrary content shown as a tooltip, and the example shows it holding several labelled lines separated by newlines. That is how you attach the environment details that make a benchmark number interpretable six months later, and it is worth using even though it is optional.
Three required fields is a low bar to clear, which is what makes the custom path viable. The action does not ask you to model your benchmark in any particular way, only to produce numbers with units and names.
Where the action's own code sits
The test scripts are conventional Jest, with `test`, `test-s` for silent, `test:watch`, and coverage targets including one that opens the HTML report. Linting is ESLint 8 with TypeScript and Prettier configuration, formatting runs through Prettier, and the build is a plain `tsc` against `tsconfig.build.json`.
The repository includes `.yamllint.yml`, `.codecov.yml`, `.coderabbit.yaml`, `CHANGELOG.md`, `CONTRIBUTING.md`, `action.yml`, `action-types.yml` and `CLAUDE.md`.
Maintenance and the honest limitation
The recent releases are v1.22.2 on 2026-09-15, v1.22.1 on 2026-05-06 and v1.22.0 on 2026-03-31. The last push was on 2026-09-15, the same day as the newest tag, and the default branch is master. The repository is not archived and the licence is MIT, with a LICENSE.txt at the root.
The pattern in the tags is worth reading: three releases across roughly six months, in the 1.22 line. That is the cadence of a stable tool receiving bug fixes and new adapters, not one undergoing redesigns.
The honest limitation is that this action can only be as good as the stability of your benchmarks. It compares a number against the previous one and alerts when it moves past a threshold you set. A benchmark whose variance is larger than the regressions you want to catch will produce failures that are noise, and the usual response is to loosen the threshold, which is how a performance gate quietly stops working.
The `range` property exists precisely because of that problem. A benchmark that reports its own variance lets you reason about whether a movement is meaningful, and supplying it for custom benchmarks is the difference between a useful signal and a coin flip.
There is also a scope limit that is easy to miss: the Luau row in the README table reads Coming soon for both the workflow and the example project, even though `benchmarkluau` is listed as supported. That is a small indicator of how support is added, incrementally and per language.
Editorial conclusion
Adopt github-action-benchmark if you already run benchmarks in CI and want the results to persist across commits with regression alerting, since it saves you building storage and comparison yourself. Do not adopt it if your benchmarks are noisy enough that a threshold failure would be noise, since the alert is only as good as the stability of the numbers behind it. Verify first which of the supported tools your project uses, confirm your output format parses, and check the gh-pages branch requirement, since results live there rather than in an artifact.
Frequently asked questions
Which benchmark tools does github-action-benchmark support?
cargo bench, go test -bench, benchmark.js, pytest-benchmark, the Google Benchmark Framework, Catch2, BenchmarkTools.jl, Benchmark.Net, benchmarkluau and JMH, plus custom benchmarks through customBiggerIsBetter and customSmallerIsBetter. Multiple languages in one repository are supported.
Where does github-action-benchmark store results?
In a gh-pages branch, with the charts served from your project's GitHub pages. Hovering a data point shows the commit hash, commit message, date, committer and benchmark value, clicking opens the commit, and a download button exports the results as JSON.
How do I report a custom benchmark?
Provide a JSON array where each entry has name, unit and value, with optional range for variance and extra for tooltip content. Then use customBiggerIsBetter or customSmallerIsBetter so the action knows which direction is an improvement.
How does the action alert on a performance regression?
It compares current results against previous ones and, when a result is worse by more than a specified threshold, raises an alert through a commit comment or fails the workflow. The reliability of that signal depends on how stable your benchmark output is.
Official sources
Add this badge to your README
If you maintain this project, the badge below links readers to this analysis and shows its maintenance status from the daily GitHub snapshot. Paste the markdown into your README; add ?metric=license or ?metric=stars to the image URL for a different field.

[](https://hysenlabs.com/projects/benchmark-action-github-action-benchmark)Star history chart for your README
[](https://hysenlabs.com/projects/benchmark-action-github-action-benchmark)Was this useful?