react-pivot turns your row objects into a grouped, filtered table
React-Pivot is a data-grid component with pivot-table-like functionality for data display, filtering, and exploration.
At a glance
- What is it?
- react-pivot is a React data grid with pivot-table behaviour, where you hand it rows, dimensions, a reduce function and a list of calculations, and it does the grouping, sorting, pagination, solo filtering and CSV export. The npm package is at version 6.2.0 with MIT licensing and ships ESM, CommonJS and a browser UMD build, and the repository itself still lists responsive layout and better pagination as open work.
- Who is it for?
- react-pivot is a good fit for an internal reporting screen where a business user needs to slice a fixed set of rows without writing code, because the reduce function is a normal JavaScript reducer you can shape however the domain needs and the component handles grouping, pagination and export around it.
- Can I use it commercially?
- Not without permission. GitHub finds no licence file in the repository, and without a licence all rights are reserved by default: you may read the code but not reuse it. Check the README, or ask the authors, before using it.
- Is it still maintained?
- Activity is slowing. The repository last received commits 7 months ago.
- What is it written in?
- Mainly JavaScript, according to GitHub's language statistics.
Answers come from the project's GitHub data, last synced on November 7, 2026, and from our analysis. They are not legal advice.
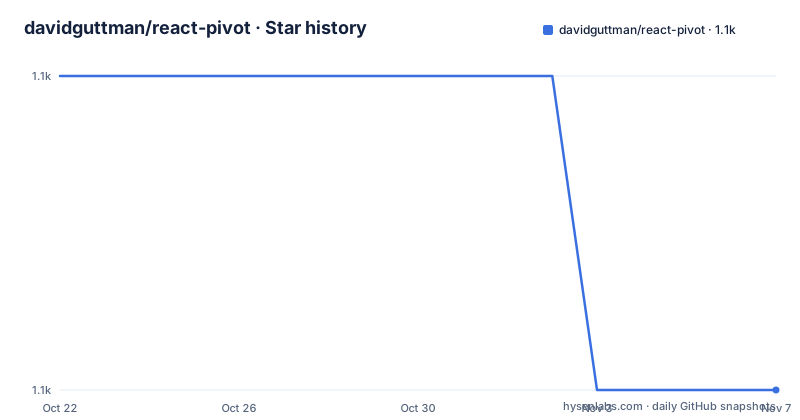
Star history
- davidguttman/react-pivot1,077 ★ · -1
| Repository | 2026-10-22 | 2026-11-07 |
|---|---|---|
| davidguttman/react-pivot | 1.1k | 1.1k |
-1 Stars in the last 16 days, measured from the daily GitHub snapshot. Compare with other projects
Editorial analysis
A pivot table as a component, not a spreadsheet you rebuild
The problem is the one every internal tool hits. There is an array of objects, and a user wants to see the totals grouped by one or two fields, sorted by a computed number, and exported as a CSV, without asking a developer for a new screen. ReactPivot is a data grid component with pivot-table-like functionality for data display, filtering and exploration, and the whole interaction model is a single component that you mount with a container element. The demo is served from the repository's GitHub Pages site, and the package is installed from npm as react-pivot. The interesting design decision is that the component does not know anything about your data. It knows about grouping, sorting, pagination and filtering, and you supply the arithmetic. That is what makes it usable across domains without configuration, and it is also the boundary you have to accept, since anything your grouping cannot express in one reduce pass is out of scope for the component.
Four props, and three of them are yours to write
ReactPivot requires four arguments, and the documentation is explicit about them: rows, dimensions, reduce and calculations. The modern ES module usage looks like this:
import React from 'react'
import { createRoot } from 'react-dom/client'
import ReactPivot from 'react-pivot'

const root = createRoot(document.getElementById('root'))
root.render(
  <ReactPivot
    rows={rows}
    dimensions={dimensions}
    reduce={reduce}
    calculations={calculations}
    nPaginateRows={25}
  />
)
rows is your data, just an array of objects, and the example data shows the shape, a flat object per row with a nested transaction object holding amount, date, business, name, type and account. dimensions is how you want to group the data, a list of a value key and a title, so a dimension of firstName titled First Name groups by that field. reduce is how you calculate numbers for each group, and calculations is how you want to display what reduce produced. The component does the grouping, so you never write a groupBy. The cost of that convenience is that a reduce function is a function, and a function is where the bugs live.
The reduce function is a reducer, and its return value defines the columns
The reduce contract is a familiar reducer shape. It takes a row and a memo, and returns the memo:
var reduce = function(row, memo) {
  memo.amountTotal = (memo.amountTotal || 0) + parseFloat(row.transaction.amount)
  return memo
}
The keys you set on the memo are the values you can then display, and the calculations list binds those keys to columns with a title, a value key and a template:
var calculations = [
  {
    title: 'Amount', value: 'amountTotal',
    template: function(val, row) {
      return '$' + val.toFixed(2)
    },
    sortBy: function(row) {
      return isNaN(row.amountTotal) ? 0 : row.amountTotal
    }
  }
]
Two details in that snippet matter in practice. The template formats the value for display, so currency and formatting live in the calculation rather than in the reduce. The sortBy function is a separate hook, and it has to guard against NaN, which is what happens when a group has no numeric value for that key. Sorting on the raw value without that guard is the most common way to get a table that sorts unpredictably, because a single NaN poisons the comparison. If your aggregation needs more than one pass over the rows, or needs to know the group before computing, that is where this model stops being convenient, and you would compute the aggregates yourself and hand in rows that are already summarised.
Solo filters let a user drill into one value
The filtering model is called solo filtering, and the description is simple. Users click on values in the table to filter the data so that only rows matching that value are shown. When solo filters are active, you can optionally display a Clear Filters button that removes all filters at once:
<ReactPivot
  rows={rows}
  dimensions={dimensions}
  reduce={reduce}
  calculations={calculations}
  showClearFilters={true}
  clearFiltersText="Reset Filters"
/>
The clearFiltersText prop is optional and defaults to Clear Filters, and when showClearFilters is true the button appears in the same toolbar row as the solo filter dropdown and the Pause Filters control, so filters can be cleared in one click. The name solo is the key to the design. Only one value per dimension is active at a time, and clicking another value in the same dimension replaces it, which keeps the table readable instead of letting the user build an unreadable cross product of filters. There is a Pause Filters control in the same toolbar, and the solo prop lets you preset the active filters by dimension, with a default of an empty object, so a deep link or a saved view can start on a filtered state.
The optional props cover export, hidden columns and row filtering
The documented option list is where you find out what the component does beyond the pivot. csvDownloadFileName assigns the name of the document created when the user clicks Export CSV and defaults to table.csv, and csvTemplateFormat applies the template formatting to the data before the export, so a column that displays as $399.73 exports as the same string rather than as the raw number. hiddenColumns takes an array of columns that should not display, tableClassName assigns a CSS class to the table containing the react-pivot elements, and defaultStyles applies the default styles from style.css, which is a file the package ships. nPaginateRows sets the items per page and defaults to 25, sortBy names the column used for record sort and defaults to null, and sortDir is either asc or desc. Two of them are less obvious. hideRows is a function, and rows passed to it will not render unless the return value is true, which is how you implement a permission or visibility rule at row level. And hideDimensionFilter stops the dimension filter from rendering at all, which is what you want for a small read-only table.
Three module formats, and the style file you have to remember
Packaging has been modernised. The package is published as an ES module, with the exports map pointing import at dist/react-pivot.es.js and require at dist/react-pivot.umd.cjs, and the main and browser fields both pointing at the UMD CommonJS build. The README shows the three consumption styles, ES modules with createRoot, a CommonJS variant for legacy support, and a UMD build loaded from a script tag, where the browser global path is served from unpkg at dist/react-pivot.umd.js. The component is now compatible with React 19 and modern build tools, and the repository itself is a Vite project with vite.config.mjs, a separate demo config, and scripts for dev, example, build, build:demo and preview. The dependencies are small and legible: dataframe, lodash, wildemitter, xtend and create-react-class. The one packaging detail to keep in mind is style.css, which is shipped in the files list and has to be imported by the host application, otherwise the default styling is not applied.
Responsive layout and pagination are still open work
The TODO list in the README is short and worth reading: better pagination and a responsive table. The second one is the practical limit. A pivot grid is a wide table by nature, and this component does not yet have an answer for a narrow screen, so on mobile you get a table that either scrolls awkwardly or overflows. The first one matters at the other end, with pagination behaviour that the author considers improvable, and nPaginateRows at 25 rows per page is the only control. The project's version is 6.2.0 in package.json, the licence is MIT, and the repository has no GitHub releases, so the npm version is the only version marker. The last push was on 2026-04-06, which means the tree is not moving quickly, and the repository has a CLAUDE.md, so the author is open to machine-assisted contributions. If you need a grid that is supported, responsive and released on a schedule, this is not it. If you need a pivot view for an internal screen, the four-prop contract is small enough to adopt and, if it stops fitting, small enough to replace with your own aggregation.
Editorial conclusion
react-pivot is a good fit for an internal reporting screen where a business user needs to slice a fixed set of rows without writing code, because the reduce function is a normal JavaScript reducer you can shape however the domain needs and the component handles grouping, pagination and export around it. It is the wrong fit for a grid that has to stay usable on a phone, since responsive table support is still an open TODO, and for a product that needs a supported dependency, since the package is at 6.2.0 with no GitHub releases and the last push was on 2026-04-06. Before adopting it, check that your aggregation fits a single reduce function, verify the table against your widest dataset.
Frequently asked questions
What props does react-pivot require?
Four: rows, which is an array of objects, dimensions, which describes how to group the data, reduce, a function that calculates values for each group, and calculations, which describes how to display the values the reduce function produced.
How do I export the table to CSV?
The component provides an Export CSV action. The csvDownloadFileName prop sets the name of the created document and defaults to table.csv, and csvTemplateFormat, which is false by default, applies the template formatting to the data before the export.
What are solo filters in react-pivot?
They let users click values in the table to show only rows matching that value. Setting showClearFilters to true adds a button in the toolbar row that removes all filters at once, and its label can be changed with clearFiltersText, which defaults to Clear Filters.
How do I hide certain rows in react-pivot?
Pass a function to the hideRows prop. Rows that are passed to the function will not render unless the return value is true, which lets you implement a visibility or permission rule at row level.
Official sources
Add this badge to your README
If you maintain this project, the badge below links readers to this analysis and shows its maintenance status from the daily GitHub snapshot. Paste the markdown into your README; add ?metric=license or ?metric=stars to the image URL for a different field.

[](https://hysenlabs.com/projects/davidguttman-react-pivot)Star history chart for your README
[](https://hysenlabs.com/projects/davidguttman-react-pivot)Was this useful?