RoEIM: A University-Built Romanian Economic COVID-19 Monitor
🇷🇴💹📉📊 Romanian Economic Monitor
At a glance
- What is it?
- RoEIM is an open-source dashboard from Babeș-Bolyai University that tracks the pandemic's economic impact on Romania. It combines daily updated data, interactive infographics, and forecasting scenarios for policy makers.
- Who is it for?
- Adopt RoEIM if you need a transparent, daily-updated source of Romanian economic data during the pandemic, especially for academic or policy research. Do not adopt it if you require a maintained, actively developed project, as the last push was in April 2021 and the license is marked NOASSERTION.
- Can I use it commercially?
- Check first. The repository uses a licence we do not classify automatically, so read its LICENSE file before any commercial use.
- Is it still maintained?
- Yes. The repository received new commits within the last day.
- What is it written in?
- Mainly CSS, according to GitHub's language statistics.
Answers come from the project's GitHub data, last synced on October 22, 2026, and from our analysis. They are not legal advice.
Star history
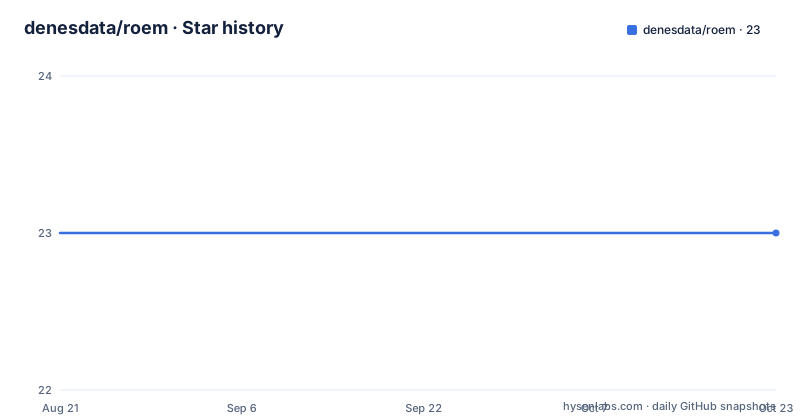
- denesdata/roem23 ★ · +0
| Repository | 2026-08-21 | 2026-10-22 |
|---|---|---|
| denesdata/roem | 23 | 23 |
0 Stars in the last 62 days, measured from the daily GitHub snapshot. Compare with other projects
Editorial analysis
What RoEIM Actually Provides
RoEIM, short for Romanian Economic Impact Monitor, is a research platform built by the Faculty of Economics and Business Administration at Babeș-Bolyai University in Cluj-Napoca. Its purpose is to publish daily data on how the coronavirus pandemic affected the Romanian economy. The site presents interactive infographics that are refreshed daily, giving decision makers in politics and economics a precise and regularly updated analysis. The project also aims to support forecasting scenarios to protect society, companies, employees, and supply chains. The target audience is clearly Romanian policy and economic decision makers, plus researchers who need a reliable data source. The README is trilingual, in Romanian, English, and Hungarian, which reflects the university's multilingual environment and broadens the potential user base.
The Architecture: A Data Repository and a Web Frontend
The repository layout shows a separation between the website code and the data it displays. The README points to a dedicated data repository, updated daily by a bot called @roeimbot, that contains the data in a standardized format. The wiki has a page about this data, and the main site pulls from it to render the infographics. The primary language listed is CSS, which suggests the project's emphasis is on styling and presentation rather than complex backend logic. This is a static-site approach: the data is pre-processed and stored in files, and the frontend visualizes it. The build instructions are on the wiki, but the README does not specify the exact framework or tooling. From the repository structure, you can infer that the site is built from a set of source files, and the data is updated independently by the bot.
Getting It Running: Build and Data Setup
The README directs you to the Wiki for build instructions, but it does not include the commands directly. The wiki page, linked as covid19-romania/wiki, presumably contains the steps to set up a similar site. Since the project is primarily CSS, you likely need a web server to serve the static files, and you would clone the repository. The data is stored in the data directory within the same repo, and it is updated daily by the bot. To run your own instance, you would pull the latest data from that directory. The README mentions a release 2.0 called RoEIM 1.1, which suggests a versioning scheme where the site version and the data version may differ. Without the wiki content, I cannot provide exact commands, but the pattern is clear: clone, serve, and let the bot update the data files.
Limitations: A Frozen Project with Unclear Licensing
The most obvious limitation is that the project has not been updated since April 2021. The last push and release 2.0 are both from that date, and the repository is not archived, but it is effectively dormant. This means the daily data updates have likely stopped, which defeats the core promise of a real-time monitor. Another issue is the license. GitHub shows NOASSERTION, meaning the repository does not have a recognized open-source license file. The README, however, states that you are free to use the site and data under an MIT attribution license, and it includes a citation style. This discrepancy is a red flag for anyone wanting to reuse the code or data legally. You would need to contact the maintainers to clarify the actual licensing terms. The project also relies on a bot that may no longer be running, so the data repository's freshness is uncertain.
Why the CSS-Heavy Approach Matters
The fact that CSS is the primary language is telling. It suggests that the project's complexity lies in the visualizations, not in the data processing. The interactive infographics are the main deliverable, and the site likely uses a JavaScript library for charts, but the styling dominates the codebase. This is a trade-off: the site is visually polished, but the underlying data pipeline is simple, which is fine for a research project with a small team. For a developer looking to build a similar dashboard, this means you can focus on frontend design rather than backend infrastructure. However, it also means there is no built-in API or dynamic server-side rendering. Everything is static, which is good for performance but limits interactivity beyond what client-side JavaScript can do.
Alternatives: Comparing with General-Purpose Dashboard Tools
A real alternative to RoEIM is a general-purpose data visualization platform like Grafana or a static site generator with charting libraries such as Hugo or Jekyll combined with Chart.js. The key difference is that RoEIM is a bespoke, research-specific project with a predefined data format and a daily update bot. Grafana, in contrast, is a configurable dashboard that connects to live data sources and provides its own alerting and querying. If you need to monitor economic indicators in real time, Grafana would give you more flexibility and ongoing community support. RoEIM, on the other hand, is a finished product tailored to a specific academic context. It is not designed to be extended easily, and its maintenance depends on the university team. For a one-off research project, RoEIM's approach is simpler, but for a production system, a general tool is more sustainable.
Maintenance and Upgrade Costs
The maintenance burden for RoEIM is low in terms of code changes, but high in terms of data freshness. The codebase is static, so there is little to upgrade unless you want to add new visualizations or change the styling. The real cost is keeping the data repository updated daily, which requires a bot that runs reliably. The project has had three releases, with the last one in 2021, indicating that the team did not see a need for frequent feature updates. If you adopt this project, you must be prepared to maintain the bot yourself or accept that the data will become stale. The wiki has instructions for building a similar site, which suggests that the team intended to share their methodology, but the documentation is external and may not be complete. The license ambiguity adds a legal cost: you cannot confidently redistribute the code without clarifying the terms.
Editorial conclusion
Adopt RoEIM if you need a transparent, daily-updated source of Romanian economic data during the pandemic, especially for academic or policy research. Do not adopt it if you require a maintained, actively developed project, as the last push was in April 2021 and the license is marked NOASSERTION. Before using, verify the data repository's update frequency and confirm the license terms with the maintainers, since the README mentions an MIT attribution license but GitHub does not assert it. Check the wiki for build instructions and the data format to see if it fits your needs.
Frequently asked questions
What stack does the roem Romanian Economic Monitor run on?
Traefik 1.7.2-alpine terminates traffic on ports 80 and 443 and routes by hostname to Grafana 7.0.0 on port 3000. Grafana reaches InfluxDB for time series storage and a grafana-image-renderer container capped at 400 MB and 0.25 CPU for panels delivered as images.
Can I reuse the data from the Romanian Economic Monitor?
Yes, under an MIT attribution licence. The data is published separately in a standardised format in a dedicated repository updated daily by roeimbot, and the README supplies citation formats in Romanian, English and Hungarian, each giving the year, the site address and a last accessed date.
Who maintains roem and how do I report a problem?
The project is run by researchers at the Faculty of Economics and Business Administration of Babes-Bolyai University in Cluj-Napoca. Technical and visualisation questions go to Denes, economics and content questions to Levente, and bugs or feature requests go on the Issues page of the covid19-romania repository, which is the path the README links to rather than the current repository.
Official sources
Add this badge to your README
If you maintain this project, the badge below links readers to this analysis and shows its maintenance status from the daily GitHub snapshot. Paste the markdown into your README; add ?metric=license or ?metric=stars to the image URL for a different field.

[](https://hysenlabs.com/projects/denesdata-roem)Star history chart for your README
[](https://hysenlabs.com/projects/denesdata-roem)