pihole-exporter: a Prometheus exporter for Pi-hole
A Prometheus exporter for PI-Hole's Raspberry PI ad blocker
At a glance
- What is it?
- The eko/pihole-exporter is a Go service that scrapes a Pi-hole instance and publishes its query and blocking statistics as Prometheus metrics, with two ready-made Grafana dashboards. It suits anyone running Pi-hole at home who wants to see DNS traffic on the same dashboards as the rest of their infrastructure.
- Who is it for?
- Adopt pihole-exporter if you run Pi-hole and want its DNS statistics as Prometheus metrics rather than read off a web admin page, and you are willing to give it the Pi-hole admin password or a WEBPASSWORD API token. Skip it if you already scrape Pi-hole's own API directly, since the exporter is a thin wrapper over that, and be careful with `SKIP_TLS_VERIFICATION=true` on a network you care about.
- Can I use it commercially?
- Yes. MIT is a permissive licence: you can use, modify and sell software built on it, as long as you keep its copyright and licence notices.
- Is it still maintained?
- Yes. The repository last received commits 7 days ago.
- What is it written in?
- Mainly Go, according to GitHub's language statistics.
Answers come from the project's GitHub data, last synced on November 6, 2026, and from our analysis. They are not legal advice.
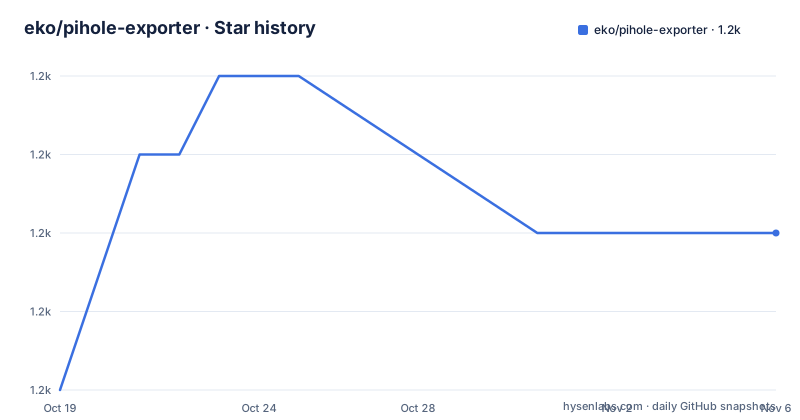
Star history
- eko/pihole-exporter1,175 ★ · +2
| Repository | 2026-10-19 | 2026-11-06 |
|---|---|---|
| eko/pihole-exporter | 1.2k | 1.2k |
2 Stars in the last 18 days, measured from the daily GitHub snapshot. Compare with other projects
Editorial analysis
A scraper for the Pi-hole admin API
pihole-exporter is a Prometheus exporter for the Pi-hole Raspberry Pi ad blocker, written in Go with the module path `github.com/eko/pihole-exporter` and a go.mod requiring Go 1.24.1. What it does is narrow and useful. It talks to a Pi-hole instance, collects the statistics Pi-hole already tracks, and republishes them as Prometheus metrics on its own HTTP port. The dependency list shows the shape of it. `heetch/confita` handles the configuration, `prometheus/client_golang` is the metrics library, `sirupsen/logrus` the logging, `stretchr/testify` the tests, `xonvanetta/shutdown` the graceful shutdown handling, and `golang.org/x/net` the HTTP client. The primary language is Go, the licence is MIT, the project is not archived, and the last push was on 2026-05-03 with releases v1.2.0 on 2025-07-29, v1.1.0 on 2025-05-02 and v1.0.1 on 2025-03-06.
The metric names tell you what is being collected
The debug log at startup lists every metric as it is registered, and the list is the clearest description of what the exporter reports. You get `domains_blocked`, `dns_queries_today`, `ads_blocked_today`, `ads_percentag_today` with that spelling, `unique_domains`, `queries_forwarded`, `queries_cached`, `clients_ever_seen`, `unique_clients`, `dns_queries_all_types` and `reply`. There are also `top_queries`, `top_ads` and `top_sources`, which are label sets rather than simple counters, since they carry a name label for the domain or client. The interesting consequence is that the exporter is a read-only observer. It does not change Pi-hole configuration, it does not pause or flush the query log, and it does not report the blocklist contents. The value is in the time series: a daily counter of blocked domains tells you whether your blocklist is still doing anything, and the forwarded versus cached split tells you whether clients are bypassing DNS.
Running it with Docker, and the credential problem
The container is published at `ekofr/pihole-exporter` and the documented run passes the target Pi-hole and the exporter's own port through the environment:
$ docker run \
  -e 'PIHOLE_HOSTNAME=192.168.1.2' \
  -e 'PIHOLE_PASSWORD=mypassword' \
  -e 'PORT=9617' \
  -p 9617:9617 \
  ekofr/pihole-exporter:latest
The credential is the part to think about. The password is the Pi-hole admin password, and the documentation also shows using Pi-hole's `WEBPASSWORD` as an API token instead, extracted from the Pi-hole configuration file:
$ API_TOKEN=$(awk -F= -v key="WEBPASSWORD" '$1==key {print $2}' /etc/pihole/setupVars.conf)
$ docker run \
  -e 'PIHOLE_HOSTNAME=192.168.1.2' \
  -e "PIHOLE_PASSWORD=$API_TOKEN" \
  -e 'PORT=9617' \
  -p 9617:9617 \
  ekofr/pihole-exporter:latest
Note that the two variables are used interchangeably, the token is passed as the password. The `WEBPASSWORD` in a Pi-hole `setupVars.conf` is the hash of the admin password, and the API accepts it as a bearer-style token, which is the mechanism that lets a separate machine authenticate without the plaintext password. If you run Pi-hole behind HTTPS, the exporter needs the `PIHOLE_PROTOCOL` variable set to `https` and your certificates mounted in, because the image has none baked in.
One exporter for several Pi-hole instances
A single exporter instance can monitor multiple Pi-hole instances, which is the feature that matters if you run one on a Pi in the house and another in a lab or a container. You specify lists of hostnames, protocols, passwords or tokens and ports, separated by commas in their respective variables:
$ docker run \
  -e 'PIHOLE_PROTOCOL=http,http,http" \
  -e 'PIHOLE_HOSTNAME=192.168.1.2,192.168.1.3,192.168.1.4"' \
  -e "PIHOLE_PASSWORD=$API_TOKEN1,$API_TOKEN2,$API_TOKEN3" \
  -e "PIHOLE_PORT=8080,8081,8080" \
  -e 'PORT=9617' \
  -p 9617:9617 \
  ekofr/pihole-exporter:latest
If the port, protocol and credential are the same for every instance, you specify each of them only once and list only the hostnames. The matching between the lists is positional, so a mismatch in list lengths is a configuration error that will not be caught until a scrape fails, and the exporter publishes everything on one endpoint rather than per-instance paths. That is a trade-off worth naming. One endpoint keeps the Prometheus scrape configuration to a single job, but it also means the metrics from several Pi-holes arrive in the same series, distinguished only by whatever labels the exporter attaches, if any.
Building from source, and the cross-compile for a Pi
The prerequisites are just Go, and there are two ways to get the sources:
$ go install github.com/eko/pihole-exporter@latest
# or
$ git clone https://github.com/eko/pihole-exporter.git
From a clone you vendor the dependencies and build. The example given is for a Raspberry Pi ARM target:
$ go mod vendor
$ GOOS=linux GOARCH=arm GOARM=7 go build -o pihole_exporter .
The `GOARM=7` value is the notable part, since it selects the ARMv7 instruction set and the build will produce something that will not run on a Cortex-A53. Running the binary directly is the same as under Docker, with the flags spelled out:
$ ./pihole_exporter -pihole_hostname 192.168.1.10 -pihole_password azertyThe startup log echoes the configuration it resolved, printing the hostname, the password, the port and a timeout of 5s, followed by the metric registration lines. The same log is where you check that a hostname typo did not silently produce an exporter with no data.
The container is a scratch image with no shell
The Dockerfile is a two-stage build ending in an image with almost nothing in it. The builder is `golang:1.24.5-alpine3.21` with git and alpine-sdk added, the vendors are pulled with `go mod vendor`, and the binary is compiled with `CGO_ENABLED=0` and stripped with `-ldflags '-s -w'`. The final stage is `FROM $IMAGE` with `ARG IMAGE=scratch` as the default, so the published image has no shell, no package manager and no libc. The binary is copied in as `pihole-exporter`, the process runs as `USER 65532:65532`, and the command is `CMD ["./pihole-exporter"]`. The consequence is a small image with a small attack surface, and the cost is that debugging a running container means attaching from another container rather than shelling in.
The compose file shows how this is meant to run
The repository's own `docker-compose.yml` is a useful reference because it encodes the operational choices rather than just the command. The service uses the `latest` image with configuration read from an env file named `pihole-exporter.env`, which is also a top-level file in the repository. The only published port is 9617. Logging is explicitly capped, with the json-file driver and `max-size` 5k and `max-file` 5, which is a small footprint for a service that logs on every configuration change and periodically. The healthcheck fetches the metrics endpoint with wget and the spider flag, `http://localhost:9617/metrics`, every 300 seconds with five retries and a ten second timeout, and the restart policy is always. The healthcheck target is worth noting, because it tests the exporter's HTTP surface rather than the Pi-hole behind it, so a healthy container can still be failing to reach its target.
Two Grafana dashboards and the TLS escape hatch
Two dashboards are provided. The Prometheus one is published on Grafana Labs as dashboard 10176, with the JSON in the repository at `grafana/dashboard.json` and a preview image, and there is a second one for InfluxDB 2 using Flux, dashboard 17094, with its JSON at `grafana/dashboard-influxdb2.json`. The InfluxDB variant exists because the metric set is compatible with both backends, so the choice is about where your time series live rather than about the exporter. The other loose end is TLS. If your Pi-hole is behind HTTPS, you mount the certificates in, and if you want to skip certificate verification entirely, the documented switch is `SKIP_TLS_VERIFICATION=true`, which can go in a Docker Compose file or in the env file. That is a reasonable escape hatch for a self-signed certificate on a home network and a poor idea anywhere else, since it removes the check that the server is who it claims to be.
Editorial conclusion
Adopt pihole-exporter if you run Pi-hole and want its DNS statistics as Prometheus metrics rather than read off a web admin page, and you are willing to give it the Pi-hole admin password or a WEBPASSWORD API token. Skip it if you already scrape Pi-hole's own API directly, since the exporter is a thin wrapper over that, and be careful with `SKIP_TLS_VERIFICATION=true` on a network you care about. Before deploying, note that the exporter needs the Pi-hole admin credential, that the container runs as a non-root user 65532 with no shell image, and that the bundled compose file caps its own log at 5k with five files and checks health by fetching `http://localhost:9617/metrics` every 300 seconds.
Frequently asked questions
How do I run the Pi-hole Prometheus exporter with Docker?
Run `docker run -e 'PIHOLE_HOSTNAME=192.168.1.2' -e 'PIHOLE_PASSWORD=mypassword' -e 'PORT=9617' -p 9617:9617 ekofr/pihole-exporter:latest`, then point Prometheus at the exporter's metrics endpoint on port 9617.
Can I use the Pi-hole WEBPASSWORD as an API token?
Yes. The documentation shows extracting it with `API_TOKEN=$(awk -F= -v key="WEBPASSWORD" '$1==key {print $2}' /etc/pihole/setupVars.conf)` and passing it in the PIHOLE_PASSWORD variable in place of the plaintext password.
Can one pihole-exporter instance monitor several Pi-hole instances?
Yes. You pass comma-separated lists of protocols, hostnames, passwords or tokens and ports in their respective environment variables, and if the port, protocol and credential are the same for all of them you specify each only once and list just the hostnames.
What metrics does the Pi-hole exporter publish?
The startup log lists domains_blocked, dns_queries_today, ads_blocked_today, ads_percentag_today, unique_domains, queries_forwarded, queries_cached, clients_ever_seen, unique_clients, dns_queries_all_types, reply, and the top_queries, top_ads and top_sources label sets.
How do I build pihole-exporter for a Raspberry Pi?
Clone the repository, run `go mod vendor`, then build with `GOOS=linux GOARCH=arm GOARM=7 go build -o pihole_exporter .`. The Docker image does the same thing with a scratch base and CGO disabled.
Official sources
Add this badge to your README
If you maintain this project, the badge below links readers to this analysis and shows its maintenance status from the daily GitHub snapshot. Paste the markdown into your README; add ?metric=license or ?metric=stars to the image URL for a different field.

[](https://hysenlabs.com/projects/eko-pihole-exporter)Star history chart for your README
[](https://hysenlabs.com/projects/eko-pihole-exporter)Was this useful?