sp500: point in time index membership, and the five year gap nobody can close
Current and Historical Lists of S&P 500 components since 1996
At a glance
- What is it?
- This repository holds current and historical S&P 500 membership since 1996 as CSV, with the notebooks that rebuild it and a snapshot notebook for any date. Its author is careful about its limits: the earliest years are short of symbols, the change log is maintained by hand from Wikipedia, and the price history for delisted names still has to be bought.
- Who is it for?
- Adopt sp500 if you are backtesting an index strategy and need to know which symbols were in the S&P 500 on a given date, and if you are willing to start your usable history at 2001-01-16 rather than 1996. Do not rely on the earliest rows, since the first row holds 487 symbols and the author cannot verify what is missing.
- Can I use it commercially?
- Yes. MIT is a permissive licence: you can use, modify and sell software built on it, as long as you keep its copyright and licence notices.
- Is it still maintained?
- Yes. The repository last received commits 61 days ago.
- What is it written in?
- Mainly Jupyter Notebook, according to GitHub's language statistics.
Answers come from the project's GitHub data, last synced on November 7, 2026, and from our analysis. They are not legal advice.
Star history
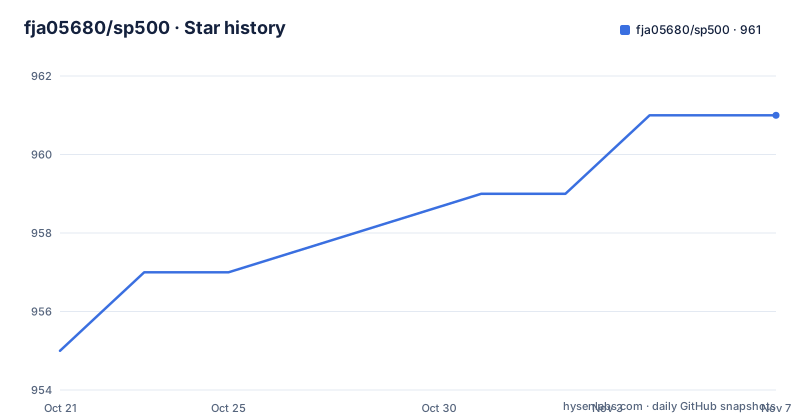
- fja05680/sp500961 ★ · +6
| Repository | 2026-10-21 | 2026-11-07 |
|---|---|---|
| fja05680/sp500 | 955 | 961 |
6 Stars in the last 17 days, measured from the daily GitHub snapshot. Compare with other projects
Editorial analysis
Index membership as a point in time table
The repository is a data project rather than a tool. It holds the current list of S&P 500 companies retrieved from Wikipedia in sp500.csv, the historical lists of S&P 500 components since 1996 in S&P 500 Historical Components & Changes (Updated).csv, and an example notebook for retrieving a snapshot of the components on a particular date.
What makes it useful is the shape of the data. A backtest that assumes the current index members existed in 2005 is wrong in a way that quietly inflates results, because companies that were removed are exactly the ones that tend to have performed badly. A point in time membership table lets a backtest know what the index actually held on each date, so the removal decisions are part of the simulation rather than something the strategy is retrofitted with after the fact.
The primary language of the repository is Jupyter Notebook, which is the right shape for this kind of project. The data is the product and the notebooks are the pipeline that produces it, so a reader can open the notebook, read the logic, and rerun it against a fresh Wikipedia page.
The topics are finance, financial data, sp500 and stock market, and the licence is MIT, so the files can be used in a commercial backtest without a licence negotiation.
Which notebook produces which file
The README describes the files as a small pipeline, and it is worth mapping it out because the inputs and outputs are not all in one direction.
`sp500.ipynb` retrieves the current S&P 500 composition from Wikipedia and outputs sp500.csv. That file is both an output and an input: it is an input to sp500_historical.ipynb.
`sp500_historical.ipynb` updates the original S&P 500 Historical Components & Changes.csv and outputs S&P 500 Historical Components & Changes (Updated).csv. The original file is the untouched input, and the updated file is the cleaned and extended result.
The third input is sp500_changes_since_2019.csv, the composition changes since 2019. The historical notebook merges the original file with those index changes to produce the updated csv, and it also does some data cleaning of the original.
Two files exist to answer narrower questions. `sp500_by_date.ipynb` demonstrates how to pull a snapshot of the components on a given date and also lists the symbols added and removed from that date to the present. `PIT to Ticker Delta.ipynb` converts a point in time list of tickers into the first and last date each ticker was in the index, and it outputs sp500_ticker_start_end.csv. The README notes the hard part: some tickers come and go multiple times, and the data integrity of the result is based on the base ticker list.
That last notebook is the one to reach for if you plan to hold a position until a symbol leaves the index.
The change log is maintained by hand, because Wikipedia is incomplete
The maintenance method is the part of this repository that most affects whether you can trust it, and the README is unusually candid about it.
The original historical file, which runs from 1996 to 2019, came from a download associated with the book Trading Evolved by Andreas Clenow. Since then, the author has updated sp500_changes_since_2019.csv every couple of months using the Wikipedia page for the S&P 500.
The first step of that update is a comparison against the current Wikipedia page to see what the differences are, and then the author notes the limitation of the source: Wikipedia shows Selected Changes, not all changes. The changes section is helpful but not always complete, so exact dates and the story of what happened have to be found by Google search. The README draws the conclusion plainly, that you cannot reconstruct the past with only the Wikipedia changes mentioned.
The merge step then combines the original file with the index changes into the updated csv.
Two things follow. The data is good to the extent that one person's manual research is good, and the update cadence is a couple of months, which means between updates the most recent membership changes are not in the change log at all. The current list is a different matter, since the author states confidence that Wikipedia has the correct current members and makes sure the final list matches it.
If your strategy depends on knowing exactly when a name was added, that is a timestamp you have to verify yourself rather than one you inherit.
The first five years are short of symbols
The README is direct about a data quality problem and offers a workaround rather than hiding it.
The count is generally not exactly 500, and as of 05-05-2021 there are 505. Sometimes there may be a few less than 500 because of the timing of additions and removals to and from the index. The first row holds 487 symbols, which comes from the original list with only data cleaning and removal of duplicates, and the author notes that the removal of duplicates was verified not to remove any unique symbols.
Then comes the admission: there may be some missing symbols for those first five years, and there is no way to independently check it. The number of symbols seems to slowly increase moving forward in time, and on 2001-01-16 there are 494 symbols, after which the count never falls below that number again.
The suggestion that follows is practical rather than optimistic. If the concern that the list is not close enough to 500 matters for your work, then perhaps just do not use the first five years of data, which still gives more than twenty years beginning in 2001.
That is the right way to treat it. If your backtest window reaches back before 2001, the membership table silently understates the index for those years, and a strategy that trades a small number of names can be distorted by a handful of missing symbols. Starting at 2001-01-16 costs you five years and removes the part of the dataset the author cannot vouch for.
Row statistics, as measured on 05-05-2021
The README publishes summary statistics for all the rows as of 05-05-2021, which is the fastest way to judge the shape of the dataset:
count  2595    (number of rows)
mean   496.44  (number of symbols)
std    5.04
min    487
25%    494
50%    497
75%    499
max    507
Two thousand five hundred and ninety five rows, a mean of 496.44 symbols per row and a standard deviation of 5.04. The quartiles sit between 494 and 499 and the maximum is 507, which is consistent with a list that hovers around five hundred and occasionally drifts above it as additions outpace removals.
The minimum of 487 is the first row and the thing to watch. Once the count settles above 494 it stays there, so the distribution is not evenly spread across the whole history. A histogram of the counts is therefore not the interesting shape; the interesting question is whether your date range starts before the series stabilises.
You still have to buy the price history
Index membership is only half of a backtest, and the README is honest that the other half costs money.
In the book behind the original list, Andreas Clenow uses Norgate Data for his stock timeseries data, and the README points to eoddata as a cheaper alternative. The README notes that you need this for the delisted and changed symbols in the S&P 500 history, because Yahoo Finance only keeps current stock history. It ends with the practical consequence: if you want to backtest stocks, you are going to need to purchase data.
That is a material limitation on how this repository can be used. The membership table tells you what was in the index, but to simulate holding a name until it was removed you need the price series of that name, and for the majority of removals since 1996 that series exists only in a commercial dataset.
The README also notes appreciation for the free data that does exist, which is a fair attitude to take toward a limitation you cannot remove. The point for an evaluator is that this repository removes the membership problem, which is the harder one to solve, and leaves the price data problem, which is a purchase rather than a project.
Symbol level data removes the need for company identities
The second note in the README describes a design decision that makes the dataset usable in a backtest without an entity mapping layer.
The ticker names are correct on any day you pick from the csv file. If they are missing later, you can assume they were removed from the index and that you sell that position. And even if the company was not removed but the symbol changed, you sell, with the algorithm picking up the new name if it meets your criteria. So the conclusion is that you do not actually need the company name or any other information linking the symbols.
This is the point in time idea applied at the position level. Because membership is recorded per date and the tickers are the identifiers, a symbol that disappears carries exactly one meaning: close the position. The dataset sidesteps the hardest part of survivorship bias work, which is deciding whether a company that was removed under one ticker and later rejoined under another is the same entity.
The `PIT to Ticker Delta.ipynb` notebook exists for the cases where that mapping does matter, and the README is candid that some tickers come and go multiple times and that the integrity of the output rests on the base ticker list. For most index strategies, where a symbol removal is a sell signal, the simpler interpretation in the second note is sufficient.
Editorial conclusion
Adopt sp500 if you are backtesting an index strategy and need to know which symbols were in the S&P 500 on a given date, and if you are willing to start your usable history at 2001-01-16 rather than 1996. Do not rely on the earliest rows, since the first row holds 487 symbols and the author cannot verify what is missing. Before you build on it, read the data notes, source your own price history for delisted symbols, and note that the last push was on 2026-09-07 with no GitHub releases, so pin a commit and keep your own copy of the change log.
Frequently asked questions
What does the sp500 repository contain?
It contains the current S&P 500 composition in sp500.csv, historical index membership since 1996 in S&P 500 Historical Components & Changes (Updated).csv, a change log since 2019, ticker start and end dates in sp500_ticker_start_end.csv, and the notebooks that produce them.
How do I get the S&P 500 components as of a specific date?
The sp500_by_date.ipynb notebook demonstrates retrieving a snapshot of the components on a certain date, and also lists the symbols added and removed from that date to the present.
How accurate is the historical sp500 data in its earliest years?
The first row contains 487 symbols and the author states there may be some missing symbols for the first five years with no way to independently check, suggesting you do not use the first five years, which still leaves more than twenty years from 2001-01-16.
Do I need to buy stock price data to use sp500?
For a full backtest, yes. The README points to Norgate Data and eoddata for the timeseries of delisted and changed symbols, because Yahoo Finance only keeps current stock history.
How is the sp500 change log kept up to date?
The author updates sp500_changes_since_2019.csv every couple of months from the Wikipedia page, and notes that Wikipedia lists Selected Changes rather than all changes, so exact dates sometimes have to be found by search.
Official sources
Add this badge to your README
If you maintain this project, the badge below links readers to this analysis and shows its maintenance status from the daily GitHub snapshot. Paste the markdown into your README; add ?metric=license or ?metric=stars to the image URL for a different field.

[](https://hysenlabs.com/projects/fja05680-sp500)Star history chart for your README
[](https://hysenlabs.com/projects/fja05680-sp500)Was this useful?