Grafana Operator for Kubernetes resource management
An operator for Grafana that installs and manages Grafana instances, Dashboards and Datasources through Kubernetes/OpenShift CRs
At a glance
- What is it?
- Grafana Operator manages Grafana instances, dashboards, data sources, and related resources through Kubernetes or OpenShift custom resources. It fits clusters that want declarative GitOps workflows, but it adds an operator and CRD layer that a single manually managed Grafana deployment may not need.
- Who is it for?
- Adopt Grafana Operator when Grafana configuration and observability resources need to be managed declaratively across Kubernetes or OpenShift, particularly through GitOps. Do not add it for one isolated Grafana installation unless operating a controller, custom resources, and their reconciliation lifecycle is acceptable.
- Can I use it commercially?
- Yes. Apache-2.0 is a permissive licence: you can use, modify and sell software built on it, as long as you keep its copyright and licence notices.
- Is it still maintained?
- Yes. The repository last received commits 2 days ago.
- What is it written in?
- Mainly Go, according to GitHub's language statistics.
Answers come from the project's GitHub data, last synced on November 6, 2026, and from our analysis. They are not legal advice.
Star history
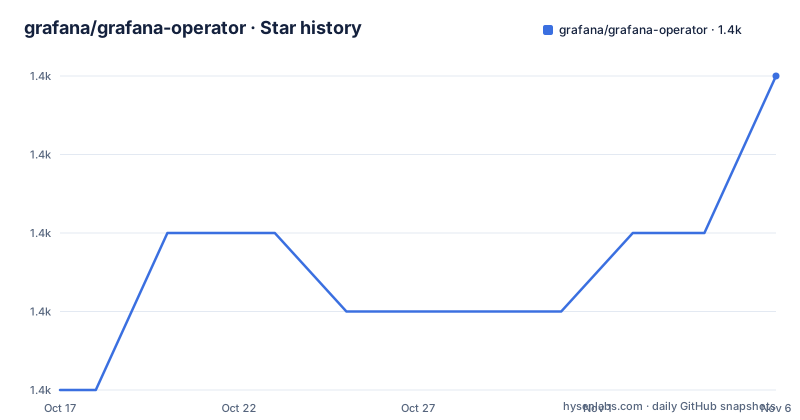
- grafana/grafana-operator1,394 ★ · +4
| Repository | 2026-10-17 | 2026-11-06 |
|---|---|---|
| grafana/grafana-operator | 1.4k | 1.4k |
4 Stars in the last 20 days, measured from the daily GitHub snapshot. Compare with other projects
Editorial analysis
Why Grafana Operator adds a Kubernetes control layer
Grafana Operator solves a configuration management problem rather than a Grafana hosting problem. It is intended for teams that need to install Grafana, declare its configuration, and manage resources such as dashboards and data sources through Kubernetes or OpenShift custom resources. The repository describes support for one instance or many, deployments in and outside Kubernetes, and workflows built around infrastructure as code, ArgoCD, or Flux CD.
This approach is most relevant when dashboard definitions, instance settings, and related objects should travel through the same review and delivery process as application manifests. A conventional Grafana deployment can still serve the underlying visualization function. The difference is ownership: with the operator, Kubernetes resources become the desired-state interface and a controller is responsible for reconciling them.
That extra layer is useful for shared platforms, where several teams or namespaces need controlled Grafana provisioning. It is less convincing for a single Grafana process with a stable configuration and no need for Kubernetes-native lifecycle management. In that case, the operator adds controllers, custom resource definitions, reconciliation behavior, and permission boundaries that do not exist in a direct deployment.
The operator is also relevant when the target is an external Grafana instance. The README explicitly includes external instances in its scope, which means Grafana Operator is not limited to deploying its own Grafana workloads. The README does not explain which reconciliation transport or authentication sequence is used for each external deployment, so those details require checking in the installation and configuration documentation.
Custom resources connect Grafana objects to controllers
The public API uses `grafana.integreatly.org/v1beta1`. A `Grafana` resource contains the desired instance configuration, while a `GrafanaDashboard` contains dashboard JSON and an `instanceSelector`. The selector connects the dashboard to Grafana resources by labels rather than embedding both objects into one manifest.
In the README example, the Grafana resource has the label `dashboards: "grafana"`. The dashboard repeats that label under `matchLabels`. This creates an explicit selection path: the operator can identify which declared Grafana instances should receive the dashboard. The dashboard also declares `resyncPeriod: 30s`, indicating that reconciliation can occur periodically even when the custom resource itself has not changed.
The repository layout supports this architecture. Directories named `api/`, `controllers/`, `config/`, `pkg/`, and `examples/` separate API definitions, reconciliation code, Kubernetes configuration, supporting packages, and example resources. The `go.mod` dependencies include `sigs.k8s.io/controller-runtime`, Kubernetes API libraries, and a generated Grafana OpenAPI client. Based on those components, the controller is positioned to watch custom resources, translate desired state, and interact with Kubernetes and Grafana APIs.
The exact reconciliation sequence is not documented in the README, so details such as conflict handling, deletion semantics, retry behavior, and dashboard update ordering should not be inferred. Those behaviors matter when using GitOps. A pull request may successfully update a CR while the controller later encounters an invalid dashboard, an unavailable Grafana endpoint, or incompatible credentials.
Helm installation and a first Grafana dashboard
The README provides a pinned Helm installation command for release 5.25.0. Run it with access to the target Kubernetes or OpenShift cluster and Helm access to the named OCI registry:
helm upgrade -i grafana-operator oci://ghcr.io/grafana/helm-charts/grafana-operator --version 5.25.0`helm upgrade -i` installs the release if it is absent or upgrades it if it is already present. The command does not create the sample Grafana or dashboard CRs. The README points to its Kustomize, OLM, and direct Kubernetes documentation for alternative installation methods, but does not give namespace selection or post-install verification steps in its installation section.
For a first declaration, save the following combined manifest under the README's documented API. It contains one `Grafana` resource and one empty-panel dashboard:
apiVersion: grafana.integreatly.org/v1beta1
kind: Grafana
metadata:
  name: grafana
  labels:
    dashboards: "grafana"
spec:
  config:
    log:
      mode: "console"
    security:
      admin_user: root
      admin_password: secret
---
apiVersion: grafana.integreatly.org/v1beta1
kind: GrafanaDashboard
metadata:
  name: sample-dashboard
spec:
  resyncPeriod: 30s
  instanceSelector:
    matchLabels:
      dashboards: "grafana"
  json: >
    {
      "title": "Simple Dashboard",
      "timezone": "browser",
      "refresh": "5s",
      "panels": [],
      "time": {
        "from": "now-6h",
        "to": "now"
      }
    }
The README does not show the command used to submit this manifest. Apply it through the cluster workflow already approved for the environment, or consult the linked installation documentation. The intended result is a Grafana resource named `grafana` and a dashboard resource named `sample-dashboard` connected by the matching label.
Dashboard selection creates a real operational dependency
The example's label-based selection works only if the controller observes both resources and can communicate with the selected Grafana instance. That makes Kubernetes reconciliation more than a YAML convenience. Operators need valid credentials, reachable service endpoints, compatible APIs, and enough permissions to create or update objects inside Grafana. The README does not document the required Kubernetes RBAC objects or Grafana service-account setup for this example, so neither should be inferred from it.
The sample also places a literal value, `secret`, under `admin_password`. It is suitable as a minimal demonstration because the README presents it directly, but it is not a documented production secret-management design. A production deployment should first confirm how the selected `Grafana` resource obtains credentials. The README does not state whether the example supports Kubernetes `Secret` references, nor does it explain rotation behavior.
The declared `v1beta1` API is another adoption checkpoint. A beta API can evolve, and a GitOps repository will encode its shape over time. Verify the custom resource definitions installed by release 5.25.0 and review the project's upgrade documentation before changing versions. The README does not document a rollback procedure, compatibility matrix, or migration path, so none can be promised from the available project pages.
The empty `panels` array also makes the example a control-plane test rather than a useful monitoring deployment. It demonstrates whether dashboard JSON can be stored and selected, but it does not exercise queries, data sources, folders, alerting resources, plugins, or external Grafana authentication.
Grafana Operator versus direct Grafana deployment
The real alternative is a traditional deployment in which Grafana is installed directly and its resources are configured outside Kubernetes. The README describes this as the deployment from which users would switch. The operator replaces manual or separately scripted lifecycle operations with CRs and controller reconciliation.
Direct deployment has fewer moving project components when there is only one instance. There is no Grafana Operator controller to install, no Grafana Operator CRDs to version, and no label selection or `resyncPeriod` to reason about. This makes it easier to understand when usage is genuinely small. It also avoids Kubernetes controller permissions as part of the Grafana administration path.
Grafana Operator becomes more appropriate when dashboards, data sources, folders, alerting objects, or multiple instances need declarative ownership. The repository's `examples/` directory includes dedicated examples for dashboards, data sources, folders, alerting rules, contact points, notification policies, service accounts, and other resources. That breadth makes the operator more useful than a wrapper limited to one Grafana container.
The trade-off is control-loop complexity. GitOps tools such as ArgoCD and Flux CD can submit CRs, but successful Git state does not by itself prove that Grafana accepted the resulting API operation. Teams adopting the operator need to distinguish manifest synchronization from Grafana reconciliation. The README links to ArgoCD guidance but does not document status conditions or an alerting policy for failed reconciliation.
Maintenance, licensing, and upgrade surface
The repository is not archived. Its last push was on 2026-10-15, and the release history includes v5.25.0 on 2026-08-24, v5.24.0 on 2026-06-09, and v5.23.0 on 2026-05-21. This indicates recent project activity, but the README does not provide a support policy or a release compatibility matrix.
The Go module identifies version 5 as `github.com/grafana/grafana-operator/v5`, while the installation command and Makefile both use version 5.25.0. The repository is licensed under Apache-2.0. That license governs the operator's source distribution, while separate components such as the Grafana image, Kubernetes distributions, dashboards, plugins, and data sources can have their own licenses. This is not legal advice. It identifies where a license review may need to expand beyond the repository's `LICENSE`.
Upgrades touch more than a container image. The Go dependencies include Kubernetes libraries at v0.37.1, `controller-runtime` at v0.25.2, OpenShift APIs, Gateway API, and Grafana client modules. Production operators should therefore check CRD changes, supported cluster versions, Grafana image compatibility, controller behavior, and changes to existing custom resources. The README does not state whether an upgrade automatically migrates stored resources or whether a manual migration is required.
Editorial conclusion
Adopt Grafana Operator when Grafana configuration and observability resources need to be managed declaratively across Kubernetes or OpenShift, particularly through GitOps. Do not add it for one isolated Grafana installation unless operating a controller, custom resources, and their reconciliation lifecycle is acceptable. Verify first that your cluster version, release compatibility, required permissions, storage choices, and target Grafana version fit the installation guide, because the README does not specify those operational details. For an adoption decision, start with the pinned Helm release and verify that the installed CRDs and controller can reconcile the exact `Grafana` and `GrafanaDashboard` resources intended for production.
Frequently asked questions
How do I install Grafana Operator with Helm?
The README documents a pinned Helm release at version 5.25.0. It also points to separate instructions for Kustomize, OpenShift OLM, and direct Kubernetes installation.
How does Grafana Operator select a Grafana instance for a dashboard?
A `GrafanaDashboard` uses `instanceSelector.matchLabels` to match labels on declared Grafana resources. The README example connects both resources through the label `dashboards: "grafana"`.
Can Grafana Operator manage external Grafana instances?
The README states that the operator can manage Grafana resources outside Kubernetes and supports external instances for GitOps integration. It does not provide the detailed connection procedure for an external instance.
Official sources
Add this badge to your README
If you maintain this project, the badge below links readers to this analysis and shows its maintenance status from the daily GitHub snapshot. Paste the markdown into your README; add ?metric=license or ?metric=stars to the image URL for a different field.

[](https://hysenlabs.com/projects/grafana-grafana-operator)Star history chart for your README
[](https://hysenlabs.com/projects/grafana-grafana-operator)Was this useful?