Grafana Pyroscope 2.0: Continuous Profiling with Direct-to-Object-Storage Architecture
Continuous Profiling Platform. Debug performance issues down to a single line of code.
At a glance
- What is it?
- Pyroscope is a continuous profiling platform. Its v2 architecture writes profile segments to object storage and separates write and query paths; deployment requirements differ between single-node and microservice modes.
- Who is it for?
- Adopt Pyroscope if you run Grafana and need line-level profiling across multiple languages with a queryless UI. It is a strong fit for teams already using Grafana Cloud or OSS and willing to manage object storage.
- Can I use it commercially?
- Yes, with strict conditions. AGPL-3.0 is a network copyleft licence: if people use a modified version over a network, for example as a hosted service, you must offer them its source code under the same licence.
- Is it still maintained?
- Yes. The repository last received commits 1 day ago.
- What is it written in?
- Mainly Go, according to GitHub's language statistics.
Answers come from the project's GitHub data, last synced on November 13, 2026, and from our analysis. They are not legal advice.
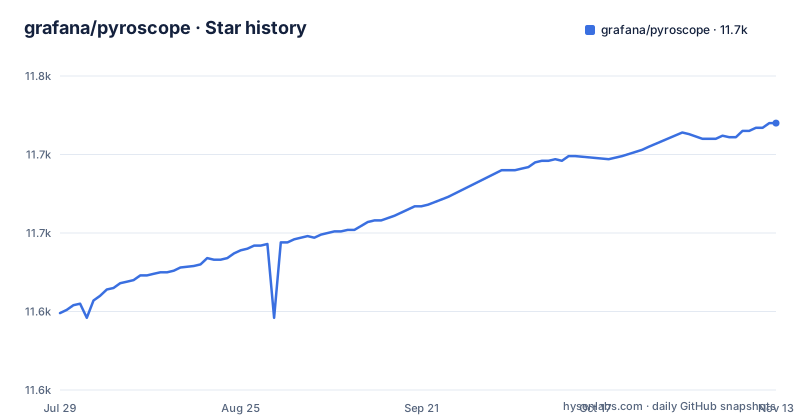
Star history
- grafana/pyroscope11,720 ★ · +121
| Repository | 2026-07-29 | 2026-11-13 |
|---|---|---|
| grafana/pyroscope | 11.6k | 11.7k |
121 Stars in the last 107 days, measured from the daily GitHub snapshot. Compare with other projects
Editorial analysis
What Pyroscope Solves and Who It Serves
Pyroscope addresses the problem of performance issues that only appear in production, where you cannot attach a debugger. It collects profiling data continuously, so you can inspect CPU, memory, and I/O usage at any point in time, down to a single line of code. The typical user is a platform or SRE team that needs to reduce resource consumption proactively, or respond to an incident reactively by identifying the exact function causing a bottleneck. The README positions it as a tool for both proactive optimization and reactive debugging. It is not a tracing system or an APM; it focuses solely on profiling data, which makes it complementary to those tools.
The v2 Architecture: Profiles Straight to Object Storage
Pyroscope v2 separates the write and query paths and writes profile segments to object storage. The segment-writer accumulates profiles into small blocks, writes them to storage and updates the metadata index; ingestion is acknowledged after durable storage and indexing by default. The query frontend plans requests, while query backends retrieve and process data using the metastore index. Compaction combines segments in the background.
For single-node deployments, the documentation permits a local filesystem as the object storage backend; microservice mode requires a supported object-storage service. The architecture replaces the v1 ingester design, but it still has components, memory use and storage dependencies to configure and monitor. Consult the current migration guide and test recovery before upgrading.
Getting It Running: Docker, Homebrew, and Binary
The quick start is straightforward. With Docker, you run `docker run -it -p 4040:4040 grafana/pyroscope`. That starts the server on port 4040, and you can then send data to it. On macOS or Linux, you can use Homebrew: `brew install pyroscope-io/brew/pyroscope` followed by `brew services start pyroscope`. For a binary, you download the archive from the latest release, unpack it with `tar xvf pyroscope_*.tar.gz`, and run `./pyroscope`. The README points to the Get started guide and server documentation for Kubernetes/Helm, Linux packages, and full configuration options. Notably, the quick start does not mention configuring object storage; that is presumably covered in the server documentation, which you must consult for production use.
Sending Data: SDKs, Alloy, and OTLP
Pyroscope accepts profiling data through three main paths. You can use language SDKs for Go, Java, Python, and others, which push profiles directly to the server. Alternatively, Grafana Alloy can pull or push profiles, acting as a collector. The third path is OTLP from OpenTelemetry-compatible sources, such as the OpenTelemetry eBPF profiler. This flexibility is a strength: you can instrument applications with SDKs for fine-grained control, or use eBPF for zero-code profiling of running processes. The README includes a table with links to language-specific documentation and examples, so the SDK coverage is clearly a priority. The README links to the client documentation for SDK setup.
Visualizing Profiles with Grafana Profiles Drilldown
The primary visualization tool is Grafana Profiles Drilldown, formerly Explore Profiles. It is described as queryless, meaning you do not write queries to explore data; you navigate through the UI. In Grafana Cloud or OSS, Profiles Drilldown is pre-installed and is the default way to explore profiles. This tight integration with Grafana is a major selling point, but it also means Pyroscope's value is tied to Grafana. If you are not a Grafana user, you would need to set up Grafana just for profiling, which may be overkill. The README mentions a live demo at play.grafana.org, so you can try the UI before committing.
Limitations and Failure Modes
Pyroscope v2's reliance on object storage introduces latency on the read path. Queries fan out across object storage, which can be slower than reading from local disk, especially for large ranges. Another limitation is that the v2 architecture is new; the README announces it as a significant change, and while v1 can migrate, the migration is not automatic. If you are on v1, you must opt in and follow the migration guide, which implies effort and potential risk. Also, Pyroscope is AGPL-3.0 licensed, which has implications for companies that want to modify and distribute the server without open-sourcing their changes. The license is a real consideration for some organizations.
Alternatives and How They Differ
The most direct alternative is Parca, an open-source continuous profiling project from Polar Signals. Parca has its own UI and does not require Grafana. The key difference is that Parca is designed to be self-contained, while Pyroscope is deeply integrated with Grafana. If you already use Grafana, Pyroscope offers a smoother experience because Profiles Drilldown is built in. If you do not, Parca avoids the Grafana dependency. Another alternative is the OpenTelemetry profiling signal, which is still evolving; Pyroscope supports OTLP, so you can use OpenTelemetry collectors, but the storage and UI are Pyroscope-specific. The choice often comes down to whether you want a Grafana-centric workflow or a standalone tool.
Maintenance and Upgrade Considerations
The v2 architecture reduces operational burden by removing ingesters, but it adds compaction workers that run in the background. You must monitor these workers to ensure they keep up with incoming data. Test compaction at your own scale. Upgrades are frequent: the repository shows releases v2.4.2, v2.3.4, and v2.4.1 within a short period (21 to 26 October 2026), indicating active development. Each upgrade may bring changes to the v2 architecture, so you should review release notes before updating. The migration from v1 is a one-time cost, but it is documented, which helps.
Editorial conclusion
Adopt Pyroscope if you run Grafana and need line-level profiling across multiple languages with a queryless UI. It is a strong fit for teams already using Grafana Cloud or OSS and willing to manage object storage. Consider the additional components if you need a standalone dashboard or are evaluating the operational cost of storage and background compaction; single-node deployments can use local filesystem storage. Before adopting, verify your object storage compatibility and retention policies, and test the migration path from v1 if you are upgrading. The v2 architecture removes ingesters, but the compaction workers and query fan-out are new operational components you must size and monitor.
Frequently asked questions
How does a Pyroscope work?
It has three main components: the Pyroscope server, which stores and processes profiling data and serves queries; clients and instrumentation that deliver data through the SDKs, Grafana Alloy, or OTLP; and Grafana Profiles Drilldown, a queryless UI for visualizing the results.
what is pyroscope
Grafana Pyroscope is a continuous profiling platform written in Go that surfaces performance insights about your applications, so you can reduce resource consumption such as CPU, memory, and I/O and debug bottlenecks down to line-level detail.
how to install pyroscope
Run the container with `docker run -it -p 4040:4040 grafana/pyroscope`, or on macOS and Linux install the tap with `brew install pyroscope-io/brew/pyroscope` followed by `brew services start pyroscope`. A release archive can also be unpacked and started directly, and the server listens on port 4040.
what does pyroscope do
It supports both proactive work, such as reducing resource consumption and preventing latency, and reactive work, such as resolving incidents with line-level detail while a CPU, memory, or I/O bottleneck is active.
Can I use Grafana for free?
The server is licensed AGPL-3.0 and runs from a single container, and the page also points at Grafana Cloud as one of the places where Profiles Drilldown is pre-installed.
Official sources
Add this badge to your README
If you maintain this project, the badge below links readers to this analysis and shows its maintenance status from the daily GitHub snapshot. Paste the markdown into your README; add ?metric=license or ?metric=stars to the image URL for a different field.

[](https://hysenlabs.com/projects/grafana-pyroscope)Star history chart for your README
[](https://hysenlabs.com/projects/grafana-pyroscope)Was this useful?