maptoposter-online, city map posters rendered in the browser
✨❤️🔥Turn the cities you love into stunning designs
At a glance
- What is it?
- MapPoster Online takes OpenStreetMap data and turns it into a designed poster entirely in the browser, using a Rust renderer compiled to WebAssembly. It is the browser counterpart to the Python maptoposter CLI, and it trades local scriptability for zero installation.
- Who is it for?
- maptoposter-online suits anyone who wants a designed map poster of a city without installing Python or a rendering stack, and it suits teams that want to self-host a poster generator for their own city guides. It does not suit a workflow that depends on batch generation from a command line, since the Rust/WASM path and the PowerShell-only wasm build script are not a pipeline.
- Can I use it commercially?
- Yes. MIT is a permissive licence: you can use, modify and sell software built on it, as long as you keep its copyright and licence notices.
- Is it still maintained?
- Yes. The repository last received commits 97 days ago.
- What is it written in?
- Mainly TypeScript, according to GitHub's language statistics.
Answers come from the project's GitHub data, last synced on November 7, 2026, and from our analysis. They are not legal advice.
Star history
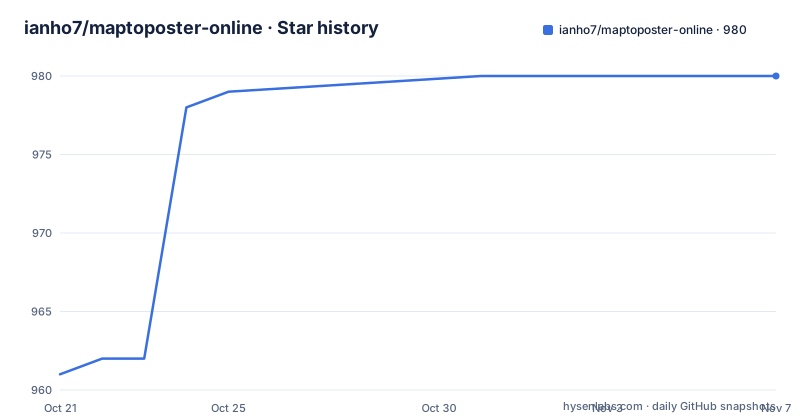
- ianho7/maptoposter-online980 ★ · +19
| Repository | 2026-10-21 | 2026-11-07 |
|---|---|---|
| ianho7/maptoposter-online | 961 | 980 |
19 Stars in the last 17 days, measured from the daily GitHub snapshot. Compare with other projects
Editorial analysis
A browser front end over a Rust renderer
MapPoster Online is described as a browser-based upgrade to maptoposter, a Python CLI, and the point of the upgrade is stated plainly: no installation needed, just open and go. The hosted version lives at maptoposter.0v0.one.
The interesting engineering decision is that the rendering is not JavaScript. The rendering engine is Rust compiled to WebAssembly with wasm-pack, drawing through tiny-skia, and the README calls it a high-performance map rendering engine. The frontend around it is React 19 with TypeScript 5, styled with Tailwind CSS v4, with Radix UI components and lucide-react for icons.
That split gives the project an unusual shape for a design tool. The React layer owns the interface, the theme, the preview and the export settings, while a compiled Rust module does the actual drawing of the map. The build tooling follows: Vite 7 with Bun as the package manager and runtime, and the scripts in package.json show the build compiling the translation catalogue, then the TypeScript, then the bundle.
The repository layout backs this up. There is a wasm/ directory for the Rust renderer, a workers/ directory, a src/ directory for the application, messages/ for the translation strings, a project.inlang/ directory for the internationalisation setup, and a scripts/ directory. There is also an AGENTS.md and a CLAUDE.md at the root, which are the files an assistant reads before touching the code.
The licence is MIT and the project is private on npm, meaning the package is not published for consumption, it is the application itself.
The map data comes from Overpass and Protomaps
The map data layer is OpenStreetMap through the Overpass API, combined with Protomaps, and the dependency list in package.json shows how the data is handled in the browser.
The maplibre-gl library does the vector tile rendering, with @mapbox/vector-tile and pbf for the tile format and @msgpack/msgpack alongside it. osmtogeojson converts the Overpass response into GeoJSON, and the turf family handles the geometry work, with separate packages for area, bbox, bbox-polygon, buffer, convex, helpers, intersect, line-split and polygon-to-line.
jsts is present too, which is the JavaScript Topology Suite, and that is a hint about what the app does with geometry rather than just displaying it: topology operations are what you need to build a clean city outline from a set of administrative relations rather than drawing a bounding box.
The rest of the dependency list is the usual web application set, Radix UI primitives for the interface, cmdk for command palettes, fuse.js for fuzzy search, class-variance-authority and clsx for styling helpers, and pinyin-pro, which is there so that place names can be searched in Chinese as well as in the local script of the city being mapped.
Since the map data is fetched from public infrastructure rather than bundled, the availability of the Overpass API and the Protomaps tiles is a real dependency of the application. A poster generator that works offline would need its own data, and this one does not have that.
Twenty themes, per-colour control and your own typeface
The design controls are the part that separates this from a map screenshot.
There are 20 built-in themes, and the README names the range: from frozen Nordic minimalism to cyberpunk neon, vintage nautical to glitch purple. On top of the theme there are custom colour controls, and the README is precise about what is adjustable: background, roads, water, green spaces, points of interest and text. Fine-tuning each of those individually is what turns a map into a poster with a hierarchy, since the point of a map poster is not that you can see the streets but that you can see them in a designed order.
Fonts are dynamic. You can use the built-in serif fonts or upload your own TTF or OTF files, which is what makes a poster feel like it was made for a place rather than generated from a template.
Custom points of interest are supported through pushpins: you search places with Amap, save your own POIs, and they are rendered on the exported poster. That is the opposite of the default behaviour, which draws the points of interest that the map data contains.
The interface is available in English, Japanese, Korean, Simplified Chinese, German, Spanish and French, and the internationalisation is handled by @inlang/paraglide-js with the message catalogue in messages/. The build compiles that catalogue before the TypeScript, which is why the build script starts with paraglide-js compile.
For anyone coming from the Python version, the difference in approach is direct. The CLI is for people who want a command line and local customisation, this is for people who want to open a page and pick a city.
Export formats and the 300 DPI promise
The export options are listed as A4 in portrait and landscape, square, phone wallpaper, desktop 16:9, and at 300 DPI for high-quality print.
That list is the practical difference between a screen image and a printable object. A square export is for a phone wallpaper or a social post, 16:9 for a desktop background, A4 for printing, and the DPI setting is what decides whether an A4 export is a poster or a blur. The gallery in the README shows the same tool applied across cities in Asia, Europe, and the Americas, Africa and Oceania, from Beijing and Tokyo through Zurich, Berlin, London and Paris to New York, Sao Paulo, Melbourne and Cape Town, which is a fair indication of what the output looks like across very different road networks and coastlines.
The live preview is the other half of the export story. You see changes instantly and confirm the result before exporting, which matters because the poster is a composition, and a change to the water colour or the road weight changes the whole balance of the design.
Two smaller features round it out. Previously fetched map data is cached in IndexedDB, through the idb library, so a regeneration is faster. And there is a snake game to play while a poster generates, inspired by the Chrome Dinosaur Game.
The build is Bun-first and the wasm step is PowerShell-only
The scripts in package.json are the clearest statement of the toolchain, and they show a project with a specific set of habits:
"dev": "vite",
"build": "paraglide-js compile --project ./project.inlang && tsc -b && vite build",
"build:wasm": "cd wasm && powershell.exe -ExecutionPolicy Bypass -File build.ps1",
"format": "oxfmt src/",
"lint": "oxlint src/",
"preview": "vite preview"
Two things stand out. The formatting and linting are oxfmt and oxlint, configured through .oxfmtrc.jsonc and oxlint.json, rather than the more familiar Prettier and ESLint pair. And the wasm build calls powershell.exe to run a build.ps1 script inside the wasm/ directory.
That last point is a practical constraint. A script that invokes powershell.exe works on Windows and on Windows-like environments, and it will not run as written on a Linux or macOS machine without modification, which means the Rust renderer is not buildable everywhere the rest of the project is. The image scanning script has the same shape, since scan:images also shells out to powershell.exe.
The requirements section of the README starts with Bun and is cut off there, so the full requirement list is not in the file, but the badges and the scripts agree on Bun 1.0 as the runtime. The dev script is Vite, and preview runs vite preview, so the usual Vite workflow applies once the environment is set up.
How the browser version and the Python CLI divide the work
The README includes a comparison table with the original maptoposter, and it is worth reading because the two are genuinely different tools rather than one being a port of the other.
On usage, the browser version is opened in a browser with no install, while the CLI needs local setup. On what each is best for, the browser version is for a quick start and on-the-go use, and the CLI is for command-line enthusiasts and advanced local customisation. On the rendering engine, the browser version uses Rust/WASM with tiny-skia and the CLI uses Python with matplotlib. On platform, the browser version is cross-browser on any device and the CLI is desktop only because it requires Python.
So the difference in approach is the rendering stack, and everything else follows from it. matplotlib in Python gives you a scriptable pipeline, batch generation over a list of cities, and the ability to tweak any parameter in a file, at the cost of an installation and a local Python environment. Rust compiled to WebAssembly gives a renderer that runs anywhere a browser runs, with a fast preview loop, at the cost of losing scriptability.
There is a third option the README does not spell out, which is the one that matters for an organisation: hosting the browser version yourself. The repository is MIT licensed and the build output is a static Vite bundle, so a team that wants a poster generator for its own cities, with its own themes and its own fonts, can deploy it on its own infrastructure and keep the data path under its own control.
Editorial conclusion
maptoposter-online suits anyone who wants a designed map poster of a city without installing Python or a rendering stack, and it suits teams that want to self-host a poster generator for their own city guides. It does not suit a workflow that depends on batch generation from a command line, since the Rust/WASM path and the PowerShell-only wasm build script are not a pipeline. Before you rely on it, check whether the wasm build works on your platform, since the documented build:wasm script shells out to powershell.exe, and confirm the map data source you need is reachable, because the map layer depends on the Overpass API and Protomaps.
Frequently asked questions
What is maptoposter-online?
It is a browser-based upgrade to the maptoposter Python CLI that turns OpenStreetMap data into designed city posters with no installation, using a Rust rendering engine compiled to WebAssembly with tiny-skia, a React 19 and TypeScript frontend, and Tailwind CSS v4.
Where does the map data come from?
From OpenStreetMap through the Overpass API, combined with Protomaps tiles. The dependency list shows maplibre-gl for the tiles, osmtogeojson for the Overpass response, and the turf packages for geometry operations such as area, bbox, buffer, convex and intersect.
Can I export a poster at print resolution?
Yes. The README lists A4 in portrait and landscape, square, phone wallpaper and desktop 16:9 export formats, at 300 DPI for high-quality print, with a live preview so you can confirm the result before exporting.
How does maptoposter-online differ from the maptoposter Python CLI?
The browser version needs no installation and runs on any device, renders with Rust/WASM and tiny-skia, and suits quick on-the-go use. The CLI requires Python and local setup, renders with matplotlib, and suits command-line work and advanced local customisation.
What are the build requirements?
The README lists Bun as a requirement, and the build uses Vite 7 with Bun, with paraglide-js compiling the translation catalogue before tsc -b and vite build. The wasm step runs build.ps1 through powershell.exe, and the image scanning script does the same, which makes those two steps Windows-oriented.
Official sources
Add this badge to your README
If you maintain this project, the badge below links readers to this analysis and shows its maintenance status from the daily GitHub snapshot. Paste the markdown into your README; add ?metric=license or ?metric=stars to the image URL for a different field.

[](https://hysenlabs.com/projects/ianho7-maptoposter-online)Star history chart for your README
[](https://hysenlabs.com/projects/ianho7-maptoposter-online)Was this useful?