PacketScope: server-side eBPF protocol analysis with Docker
🎯 A general-purpose protocol stack analysis and debugging tool based on eBPF 🧰
At a glance
- What is it?
- PacketScope combines eBPF packet monitoring, kernel function tracing, cross-layer metrics, routing analysis, and filtering behind a Docker Compose deployment. It suits Linux operators and security engineers who need visibility below conventional application-layer tools, but its privileged host networking and kernel access require careful review.
- Who is it for?
- PacketScope is a practical candidate for Linux operators and security engineers investigating packet paths, protocol-stack behavior, latency, packet loss, and lower-level filtering. It is a poor fit for environments that reject privileged containers, direct host networking, mounted kernel interfaces, or a large multi-service footprint.
- Can I use it commercially?
- Yes. MIT is a permissive licence: you can use, modify and sell software built on it, as long as you keep its copyright and licence notices.
- Is it still maintained?
- Yes. The repository last received commits 65 days ago.
- What is it written in?
- Mainly C, according to GitHub's language statistics.
Answers come from the project's GitHub data, last synced on November 7, 2026, and from our analysis. They are not legal advice.
Star history
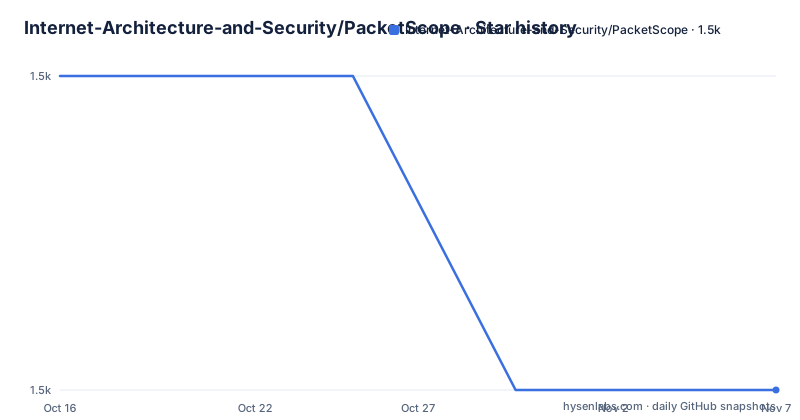
- Internet-Architecture-and-Security/PacketScope1,457 ★ · -1
| Repository | 2026-10-16 | 2026-11-07 |
|---|---|---|
| Internet-Architecture-and-Security/PacketScope | 1.5k | 1.5k |
-1 Stars in the last 22 days, measured from the daily GitHub snapshot. Compare with other projects
Editorial analysis
PacketScope's server-side observability scope
PacketScope addresses the limited visibility many web-facing tools provide when a problem happens below the application layer. The README identifies unclear packet paths, bottleneck diagnosis, routing risk, and low-level protocol attacks as its main problems. Its intended users are security engineers and operators responsible for public servers, where application behavior and kernel network behavior need to be examined together.
The project does not present itself as a conventional packet capture utility alone. It combines several views: Analyzer observes packets and kernel function calls, Calculator derives metrics across network layers, Tracer analyzes routes and risks, and Guarder handles security filtering and low-level traffic interception. The interface then presents these services through a React dashboard. This combination is useful when the question concerns not merely whether a packet arrived, but where it moved through the server stack and which components handled it.
The boundaries still need attention. The README describes global path visualization, LLM-assisted analysis, protocol-stack defense, and MCP integration as capabilities, but it does not explain detection thresholds, attack signatures, model configuration, false-positive handling, or the exact conditions under which Guarder intercepts traffic. Engineers should treat those as product claims requiring validation against their own traffic, not as proof of automated threat coverage.
Analyzer's Go and eBPF data path
The Analyzer rewrite is the clearest architectural change documented by the project. According to the README, it replaced a Python and BCC implementation with Go and `cilium/ebpf`. The stated consequence is removal of the BCC runtime dependency. The new design uses CO-RE through `bpf2go` for precompiled eBPF, which the project presents as a portability improvement across kernel environments.
Analyzer is split into Monitor and Calculator. Monitor contains `kbatch`, which uses eBPF `fentry` or `kprobe` for kernel function monitoring, and `tcxprober`, which uses eBPF TC to capture ingress and egress packets. A Go HTTP service exposes query access on port 8010 inside the service architecture. Calculator produces cross-layer measurements, including packet rates at link, network, and transport layers and latency between selected layers.
The repository also maps packet monitoring and function-call data to PostgreSQL databases named `tcxprober` and `functioninfo` in the Compose configuration. That suggests the eBPF observations are not confined to an ephemeral display: services connect to persistent storage. However, the README does not document the event schema, buffering policy, retention interval, sampling controls, or accuracy limits for cross-layer correlation. Those details matter because a dashboard can make a derived latency value appear more certain than its underlying event model warrants.
Six-service deployment behind one nginx endpoint
PacketScope is packaged as a Docker Compose system with PostgreSQL, nginx, Monitor, Calculator, Guarder, and Tracer. Most backends use `network_mode: host`, while nginx also publishes port 80. The README says that backend services communicate over the host network and that users need not expose several ports. Browser requests reach the React single-page application at `/`, while nginx proxies backend calls under `/api/guarder/`, `/api/tracer/`, `/api/monitor/`, and `/api/analyzer/`.
This arrangement simplifies the advertised browser entry point, but it is not a lightweight sandbox. The Compose file marks `analyzer-monitor` as `privileged: true`, and the README lists `/sys/kernel/btf` and `/sys/kernel/debug` as read-only mounts. Those settings expose host kernel facilities to containers. Host networking also changes firewall and service-boundary assumptions compared with isolated bridge networks.
The frontend Dockerfile performs a multi-stage build. It builds a Node 20 application with Vite, then copies `dist` into `nginx:alpine` and installs `nginx/nginx.conf`. The application therefore reaches production serving through the same reverse proxy that fronts its APIs. The README does not explain TLS termination, authentication, authorization, secret rotation, or multi-host deployment. Although only port 80 is named in the quick-start instructions, an Internet-facing deployment should not be assumed safe merely because its browser entry point is unified.
Installing PacketScope on a Docker host
The documented prerequisites are Docker 20.10 or higher and Docker Compose 2.0 or higher. Check both before cloning the repository. The version command is documented directly, so the expected result is a reported Docker version of at least 20.10 and a Compose version of at least 2.0.
docker --version
docker compose version
For an international host, the README directs users to clone the default branch and run `starter.sh` with `sudo`. The script is documented to install Docker if needed, configure mirror acceleration, build the containers, and start the services.
git clone https://github.com/Internet-Architecture-and-Security/PacketScope.git
cd PacketScope
sudo bash starter.sh
Users in China are given a separate script. The repository does not fully characterize how its mirror choices differ, so operators should inspect `install-cn.sh` before deciding which installation path fits their environment.
git clone https://github.com/Internet-Architecture-and-Security/PacketScope.git
cd PacketScope
bash install-cn.sh
Only port 80 is described as necessary in the firewall or security group. After deployment, open `http://localhost`. A first practical check is the Compose service status. The documented command should list the six services, although the README does not guarantee their exact display state at first launch.
sudo docker compose -f docker-compose.yml psReading PacketScope service health after startup
A first visit to `http://localhost` should load the React SPA through nginx. The service table gives administrators a more useful starting point than the landing page because PacketScope is a distributed application. If the page is blank or an API view is empty, the README directs users to follow the Compose logs rather than restarting blindly.
sudo docker compose -f docker-compose.yml logs -fThis command streams logs from all services. The README does not provide expected log output for a healthy Analyzer session, so an operator should use the command to identify missing services, database connection errors, kernel access failures, and startup exceptions rather than expecting one specific line. The relevant service name can then be passed to the documented restart command. The placeholder shown here is the exact syntax documented in the README.
sudo docker compose -f docker-compose.yml restart <name>To stop the complete deployment, use the documented Compose command. This does not delete the named PostgreSQL volume, because `down` without a volume-removal option only stops and removes containers and networks. The README does not provide a data deletion or volume reset procedure, so changing databases during evaluation may require direct inspection of Compose state and volume names.
sudo docker compose -f docker-compose.yml downThe repository labels six Compose services, but the frontend cannot be considered verified merely because nginx responds. Analyzer data depends on kernel access and storage, while Tracer and Guarder have distinct modules. Each feature should be checked separately in the dashboard.
Guarder, Tracer, and MCP integration boundaries
Guarder is described as a security and filtering module written with Go, eBPF, and XDP. It is exposed through `/api/guarder/` and is intended to identify or intercept abnormal low-level traffic. This is the highest-consequence component to evaluate because its documented purpose reaches beyond observation into enforcement. The README does not state its policy syntax, default rules, dry-run mode, bypass controls, or recovery behavior after a false positive.
Tracer is implemented in Python and MCP according to the project structure. It provides route tracing and risk analysis through `/api/tracer/`. Unlike Analyzer's packet and kernel telemetry, its exact data sources are not described in the README. The directory listing confirms that a dedicated module and MCP packages exist, but it does not prove which probes, external services, or routing databases it uses.
MCP integration is available through packages under `skills/` for Monitor, Tracer, and Guarder. The README associates this capability with LLM agents such as Trae and Cline. This creates an additional evaluation surface: operators need to know which actions an agent may invoke, whether filtering can be changed through the interface, and how command authorization is enforced. None of those controls is documented in the README. MCP availability should therefore not be interpreted as evidence that agent actions are constrained or safe by default.
PacketScope versus WAF and IDS placement
PacketScope is not a direct replacement for every WAF or IDS function. A WAF primarily evaluates application-layer requests and can enforce application security policies without loading eBPF programs into the kernel. PacketScope's documented distinction is its server-side view of protocol-stack traversal, including TC packet capture, kernel function calls, route tracing, and cross-layer metrics.
An IDS can also provide broader packet or flow analysis, but the README specifically frames PacketScope as addressing blind spots that traditional tools leave around low-level stack behavior. The practical difference is therefore not simply the word "security." PacketScope combines in-kernel observation with derived path and layer metrics, then exposes those results through its own dashboard and APIs.
The trade-off is deployment coupling. PacketScope depends on privileged or kernel-aware containers, host networking, kernel mounts, and multiple services. Conventional application-layer tools can be easier to place at a reverse proxy or application boundary. PacketScope is the more relevant candidate when diagnosis depends on movement below the application, but it is the weaker choice for an environment where kernel-level access is prohibited or where HTTP request filtering alone meets the requirement. Neither the license nor the feature list resolves that infrastructure boundary.
Maintenance, licensing, and upgrade work
The repository is not archived, and its last push was on 2026-09-04. Release history includes `v2.0.0` on 2026-05-30, `v1.5.0` on 2025-10-21, and `v1.1.0` on 2025-08-19. Those facts indicate recent repository activity, but the README does not define a support window for older releases.
The Analyzer rewrite is a material upgrade concern rather than a routine UI update. Moving from Python and BCC to Go, `cilium/ebpf`, and CO-RE changes the runtime and kernel integration model. Operators upgrading from an older PacketScope deployment would need release-specific migration documentation, and the README does not include one. Database compatibility, event schema changes, rule migration, and MCP configuration changes should not be assumed to be automatic.
PacketScope uses the MIT license. That generally permits broad use and modification under the license's notice conditions, but this review does not replace legal advice. Operationally, the larger cost comes from running privileged services, managing PostgreSQL data, matching kernel facilities to eBPF requirements, and reviewing changes to filter behavior. A deployment decision should account for those operational costs alongside the convenience of a single browser endpoint.
Editorial conclusion
PacketScope is a practical candidate for Linux operators and security engineers investigating packet paths, protocol-stack behavior, latency, packet loss, and lower-level filtering. It is a poor fit for environments that reject privileged containers, direct host networking, mounted kernel interfaces, or a large multi-service footprint. Before adoption, verify host compatibility and permissions first, then confirm whether the documented analyzer metrics and Guarder behavior match the traffic you need to observe. Its MIT license reduces licensing friction, although that permission does not remove deployment or operational responsibility.
Frequently asked questions
What is PacketScope used for?
PacketScope is a server-side eBPF tool for protocol-stack analysis and debugging. Its modules cover packet monitoring, kernel function tracing, cross-layer metrics, route risk analysis, and low-level security filtering.
How do I install PacketScope with Docker Compose?
Clone the repository, enter its directory, and run `sudo bash starter.sh`. The README says the script can install Docker if needed, build the containers, and start the services.
Which port does PacketScope use?
The documented application entry point is `http://localhost`, served through nginx on port 80. The README states that only port 80 needs to be opened for the advertised deployment.
Does PacketScope require BCC?
No. According to the README, the rewritten Analyzer uses Go and `cilium/ebpf` and removes the BCC runtime dependency. Its CO-RE design uses `bpf2go` for precompiled eBPF.
Can PacketScope connect to LLM agents through MCP?
The repository includes MCP packages for Monitor, Tracer, and Guarder, and the README mentions integration with agents such as Trae and Cline. The README does not specify agent permissions or authorization controls.
Official sources
Add this badge to your README
If you maintain this project, the badge below links readers to this analysis and shows its maintenance status from the daily GitHub snapshot. Paste the markdown into your README; add ?metric=license or ?metric=stars to the image URL for a different field.

[](https://hysenlabs.com/projects/internet-architecture-and-security-packetscope)Star history chart for your README
[](https://hysenlabs.com/projects/internet-architecture-and-security-packetscope)Was this useful?