jonasmr/microprofile: Embeddable C++ Profiling for Live and Captured Data
microprofile is an embeddable profiler
At a glance
- What is it?
- microprofile is a small, embeddable C++ profiler for frame-based applications, live inspection, counters, GPU timing, timelines, and saved captures. Its integration model is direct, but its dynamic instrumentation feature is explicitly experimental and has strict platform and instruction constraints.
- Who is it for?
- Developers building C++ applications that need frame-oriented profiling should verify direct C++ integration, acceptable overhead, capture retention, and platform support before adopting microprofile. Projects that require production-grade dynamic instrumentation should not treat that experimental feature as settled, especially without accepting its x86-64 and patching limitations.
- Can I use it commercially?
- Yes. MIT is a permissive licence: you can use, modify and sell software built on it, as long as you keep its copyright and licence notices.
- Is it still maintained?
- Yes. The repository last received commits 73 days ago.
- What is it written in?
- Mainly C, according to GitHub's language statistics.
Answers come from the project's GitHub data, last synced on November 7, 2026, and from our analysis. They are not legal advice.
Star history
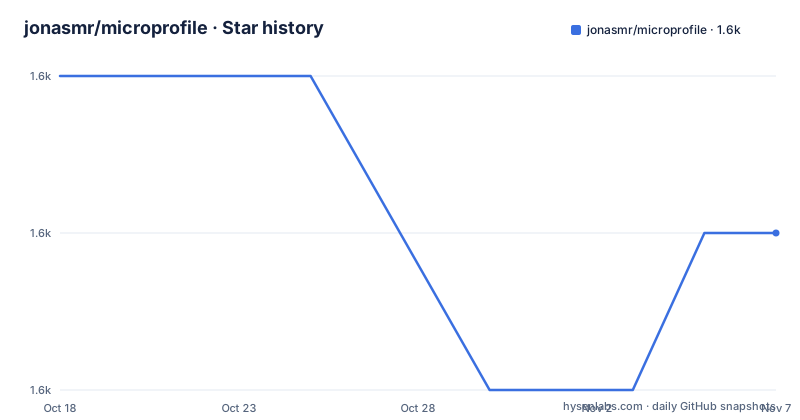
- jonasmr/microprofile1,591 ★ · -1
| Repository | 2026-10-18 | 2026-11-07 |
|---|---|---|
| jonasmr/microprofile | 1.6k | 1.6k |
-1 Stars in the last 20 days, measured from the daily GitHub snapshot. Compare with other projects
Editorial analysis
microprofile's Direct Instrumentation Model
microprofile solves the problem of adding detailed timing information inside an application without requiring a separate profiler process. It is aimed at developers who need to inspect code regions during development, understand frame costs, and retain a capture for later comparison. The implementation is described in the README as a profiler written in C++, despite the repository metadata identifying C as the primary language. The supported integration is source-level and small: the project supplies microprofile.cpp, which the application includes in its own build, together with microprofile.h for the public macros and API calls.
The primary mechanism is a scoped marker. MICROPROFILE_SCOPEI accepts a group, a timer name, and a color, then records the code placed inside its scope. This makes the profiler useful for code paths that already have meaningful boundaries, such as a frame, a loading phase, a render stage, or a subsystem update. The timer name becomes part of the captured data rather than merely a diagnostic message printed to a terminal. The README also provides counters, which can be incremented or set with MICROPROFILE_COUNTER_ADD and MICROPROFILE_COUNTER_SET. Those values appear in the live and capture views, making them useful for values such as memory totals or application state.
The design favors predictable integration over a separate runtime configuration. If no groups are enabled in the live view, the README states that no code is timed. This implies that group control is part of the runtime inspection workflow rather than a requirement to assign every possible code path a permanent reporting category.
Adding microprofile to a C++ Project
The repository documentation provides an integration example, but it does not provide a separate installation command or a package-manager installation path. The project says that microprofile.cpp must be included in the project, with microprofile.h providing the interface. A minimal first instrumentation point can be added as follows.
#include "microprofile.h"
{
    MICROPROFILE_SCOPEI("group","timername", MP_YELLOW);
    // code to be timed
}
The README calls this a frame-based example and says that MicroProfileFlip(nullptr) should be called once each frame. The null pointer is passed as the void* device context for GPU timers. Applications that do not use the frame concept, or that do not call MicroProfileFlip, can call MicroProfileDumpFileImmediately to save profile data as an HTML or CSV file. That alternative is particularly relevant for command-line tools, server startup paths, and batch jobs, although the documentation does not describe a complete setup for any one of those cases.
The source inclusion requirement makes build integration more direct than fetching a library through a package manager, but it also means the application build owns compilation of the profiler implementation. The README does not specify compiler versions, CMake variables, Meson options, or a universal set of linker flags for the core profiler. Those details would need to be confirmed against the repository build files before adoption.
Live Server Routes and Capture Retention
The live view is served by pointing a browser at host:1338/. From there, the Control menu can enable profiler groups, and the capture button records frames. By default, the capture contains the last 30 frames. The README also documents route-style addresses that alter capture length or preset selection: host:1338/100 requests a capture of 100 frames, host:1338/p/foo starts the live view and loads the named preset, and host:1338/b/foo starts the live view and loads a built-in preset.
The profiler application saves user presets in mppresets.cfg. Built-in presets come from mppresets.builtin.cfg and are intended to provide predefined configurations that cannot be overwritten. This separation is useful when a team wants to preserve a repeatable profiling setup, because the documentation distinguishes editable application presets from read-only built-in configurations.
Captures are stored in reusable ring buffers. This creates a concrete operational limitation: if a requested capture extends too far behind the current recording point, older markers may already have been overwritten, so they will be absent from the result. Reuse occurs per thread, which means retention differs by thread rather than acting as one global buffer. A capture is a self-contained webpage that can be saved and shared, but capture history is still constrained by the recording window.
GPU Timers, Counters, and Timeline Events
GPU timing follows the same marker concept as CPU timing, but all GPU timers are placed in a shared group named "GPU". The README identifies OpenGL, D3D11, D3D12, and Vulkan as supported GPU APIs, and it points to demo_nouid3d12 for a multithreaded renderer example. GPU support therefore depends on matching the application's graphics API and presenting device context through the documented flip mechanism.
Timeline markers are intended for long or unique events, such as level loading, rather than short recurring work. The README distinguishes static labels from dynamically formatted labels. MICROPROFILE_TIMELINE_ENTER_STATIC and MICROPROPROFILE_TIMELINE_LEAVE_STATIC use a static string and do not require the same token sequence as formatted events. For formatted labels, a MICROPROFILE_TIMELINE_TOKEN value identifies the corresponding leave operation while MICROPROFILE_TIMELINE_ENTERF supplies the format string and arguments.
MICROPROFILE_TIMELINE_TOKEN(token);
MICROPROFILE_TIMELINE_ENTERF(token, MP_YELLOW,
    "custom %d %6.2f", 10, 42.0f);
MICROPROFILE_TIMELINE_LEAVE(token);
The README says timeline events are always active and unique. They do not appear in aggregation, and its description of their capture behavior is incomplete, so an adopter should not assume they are equivalent to ordinary scoped timers.
Capture Comparison and File-Based Use
Captures can be compared without a live connection. The documented workflow is to save the first capture, open a second capture, and use the compare function to browse to the first file. The comparison is limited to the detailed view. Captures saved by earlier versions cannot be used for this feature, which makes capture format compatibility an upgrade concern.
There is another limitation when context-switch tracing is enabled. In that mode, comparing captures only compares registered threads. This is not a general guarantee that every thread visible in one capture will be represented in the comparison. Teams relying on multi-threaded analysis should account for both the thread registration rule and ring-buffer retention before drawing conclusions from a comparison.
For applications without a frame loop, MicroProfileDumpFileImmediately provides a direct path to disk output. The README identifies HTML and CSV as the resulting formats. It does not document a retention policy for generated files, a rotation mechanism, or a server shutdown procedure. Those are integration details that the embedding application may need to handle outside microprofile.
Experimental Dynamic Instrumentation Boundaries
Dynamic instrumentation is a separate and explicitly experimental capability, limited by the README to Intel x86-64. The supported operating systems named there are Windows, macOS, and Linux, with Linux described as tested on Ubuntu. Enabling it requires MICROPROFILE_DYNAMIC_INSTRUMENT_ENABLE, linking with distorm, and adding the distorm include directory. On Linux, the program must also be linked with -rdynamic so functions can be located through dladdr.
The operational warning is significant. The profiler does not stop all running threads while replacing instructions. The README states that a thread executing the code being patched can encounter undefined program behavior during the critical replacement period. It also says instrumentation may fail when a function does not contain at least 14 bytes of instrumentable instructions, because not every x86-64 sequence is supported.
The web interface exposes modules and functions after the feature is compiled in. Debug information must be loaded for a module before functions can be searched. Selecting a function attempts instrumentation, while selecting '>>' attempts to instrument called functions that also have names in the debug information. The README identifies the `dynamic_instrument` example, but does not claim that the feature is suitable for unattended production use. A separate sampling profiler that avoids runtime code patching would be a different approach, although the README does not document such a replacement.
License, Maintenance, and Adoption Boundaries
The repository is licensed under MIT. That permits broad use, modification, and redistribution subject to the license terms, but this review does not provide legal advice and does not replace reading the LICENSE file. The repository is not archived. Its last push was on 2026-08-26, which is more recent than six months before the current date, so there is no basis from the stated maintenance facts to label it unmaintained. The most recent listed release is v4.0 from 2022-10-19, followed by v3.1 from 2019-07-13, so release history and recent repository activity are not the same thing.
The main adoption cost is source integration. Because microprofile.cpp is included directly, developers must account for compilation, graphics API integration, marker naming, preset management, capture storage, and version-specific capture compatibility. The core profiler is attractive for a C++ application that wants live and offline views with little separate infrastructure. It is a poor match for a project that cannot compile the C++ implementation, needs a stable unattended patching system, or expects captures from older releases to remain comparable with newer detailed views.
Editorial conclusion
Developers building C++ applications that need frame-oriented profiling should verify direct C++ integration, acceptable overhead, capture retention, and platform support before adopting microprofile. Projects that require production-grade dynamic instrumentation should not treat that experimental feature as settled, especially without accepting its x86-64 and patching limitations. The first concrete check is whether including microprofile.cpp and adding MICROPROFILE_SCOPEI markers fits the existing build and rendering architecture.
Frequently asked questions
How do I add microprofile to a C++ application?
Include microprofile.h and include microprofile.cpp in the application build, then place MICROPROFILE_SCOPEI around code to be timed. The README says microprofile.cpp is the implementation file that must be included in the project.
Does microprofile support GPU profiling?
Yes. The README lists GPU timers for OpenGL, D3D11, D3D12, and Vulkan. GPU markers use MICROPROFILE_SCOPEGPUI(), and GPU timers share the group named "GPU".
Can microprofile save profiling data without a frame loop?
Yes. The README says MicroProfileDumpFileImmediately saves profile data as an HTML or CSV file when MicroProfileFlip is not used. It also identifies the noframes example as an application without a concept of frames.
Is microprofile dynamic instrumentation production-ready?
The README calls dynamic instrumentation experimental. It supports Intel x86-64 on Windows, macOS, and Linux, but does not stop all threads while patching code and cannot instrument every x86-64 sequence.
Official sources
Add this badge to your README
If you maintain this project, the badge below links readers to this analysis and shows its maintenance status from the daily GitHub snapshot. Paste the markdown into your README; add ?metric=license or ?metric=stars to the image URL for a different field.

[](https://hysenlabs.com/projects/jonasmr-microprofile)Star history chart for your README
[](https://hysenlabs.com/projects/jonasmr-microprofile)Was this useful?