ipyleaflet for Interactive Jupyter Maps
A Jupyter - Leaflet.js bridge
At a glance
- What is it?
- ipyleaflet connects Python notebooks to Leaflet.js through a Jupyter widget stack, with separate frontend and Python packages. It suits notebook users who need interactive maps, GeoJSON, controls, and visualization layers without building the browser interface manually.
- Who is it for?
- ipyleaflet is a sensible choice for Python notebook authors who need Leaflet maps with interactive widget behavior, while it is a poor fit for projects that require a standalone web map without Jupyter. Before adoption, verify that the installed Python package, notebook frontend extension, and Jupyter environment work together, and inspect the `LICENSE` file for the project's MIT licensing terms.
- Can I use it commercially?
- Yes. MIT is a permissive licence: you can use, modify and sell software built on it, as long as you keep its copyright and licence notices.
- Is it still maintained?
- Activity is slowing. The repository last received commits 6 months ago.
- What is it written in?
- Mainly TypeScript, according to GitHub's language statistics.
Answers come from the project's GitHub data, last synced on November 7, 2026, and from our analysis. They are not legal advice.
Star history
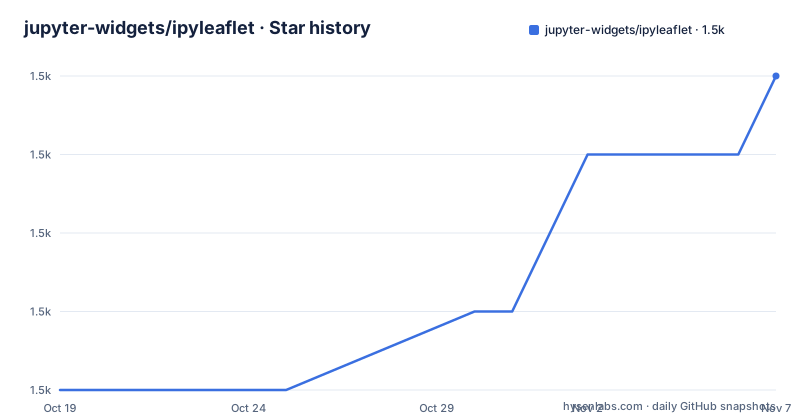
- jupyter-widgets/ipyleaflet1,546 ★ · +4
| Repository | 2026-10-19 | 2026-11-07 |
|---|---|---|
| jupyter-widgets/ipyleaflet | 1.5k | 1.5k |
4 Stars in the last 19 days, measured from the daily GitHub snapshot. Compare with other projects
Editorial analysis
Why ipyleaflet Exists in a Python Notebook
ipyleaflet addresses the gap between Leaflet.js, a browser mapping library, and Python code running inside a Jupyter kernel. A notebook author can work from Python while presenting the map as an interactive frontend widget rather than as a static image or a separately hosted web application. The repository describes it as a "Jupyter / Leaflet bridge," and its examples cover basemaps, GeoJSON, controls, velocity data, and choropleth layers.
The intended audience is notebook developers who already use Jupyter and want mapping behavior to remain connected to Python execution. That includes exploratory geographic analysis and notebook interfaces assembled from Leaflet primitives. The repository does not present ipyleaflet as a general GIS analysis package, a desktop GIS application, or a standalone mapping server. Its scope is the integration layer between a notebook and Leaflet.js.
That boundary matters. ipyleaflet can expose map components inside the notebook environment, but the README does not describe deployment as a standalone production web application. A team looking for a browser-only mapping implementation would use Leaflet.js directly. A team that needs a notebook-native map widget and accepts the Jupyter dependency has a more direct fit.
The Two-Package Architecture Behind ipyleaflet Maps
The repository separates the project into a frontend package and a Python package. The README identifies `jupyter-leaflet` as the front-end component and `ipyleaflet` as the Python backend for the Python Jupyter kernel. This structure reflects the widget model: notebook-side Python code represents the map components, while a browser-side component renders and operates the interactive Leaflet interface.
The visible examples indicate that the bridge covers more than a basic tile map. The repository includes notebooks for `BaseMap.ipynb`, `GeoJSON.ipynb`, `KML.ipynb`, `GPX.ipynb`, `Heatmap.ipynb`, `Choropleth.ipynb`, `DrawControl.ipynb`, `Fullscreen.ipynb`, `LayerGroup.ipynb`, and `CustomProjections.ipynb`. It also includes examples for custom tile servers, image services, canvas rendering, hover behavior, colormap controls, dropdown controls, and `GeomanDrawControl`.
The architecture does not remove Leaflet's browser-oriented nature. It places Leaflet behavior inside a Jupyter widget interface and leaves Python as the notebook-side backend. The repository also points to `xleaflet`, which provides a backend for the `jupyter-leaflet` front end in the `xeus-cling` C++ Jupyter kernel. That is a different kernel path, not a claim that the Python package is interchangeable with every kernel.
Installing ipyleaflet and Enabling the Frontend
The README gives two normal installation routes. Conda users can install the package from `conda-forge`, while pip users can install it directly. The command below installs the Python-side package; the notebook environment must also be able to load the corresponding Jupyter frontend component.
pip install ipyleafletFor a development installation, the README requires `yarn` and then installs both packages from their source directories. The first editable install targets the front-end package directory, and the second targets the Python package directory.
git clone https://github.com/jupyter-widgets/ipyleaflet.git
cd ipyleaflet
(cd python/jupyter_leaflet; pip install -e .)
(cd python/ipyleaflet; pip install -e .)
The source setup also includes a JupyterLab command for developing the lab extension. This is a development operation, not an extra step that the README asks ordinary package users to run.
jupyter labextension develop --overwrite jupyter_leafletThe README does not document rollback, dependency pinning, or a migration procedure for the front end. It also does not give a first executable Python snippet. The documented first-use route is therefore the documentation and the bundled examples, rather than an invented API example.
A First Map Through the ipyleaflet Examples
The repository's `examples/` directory provides the clearest documented starting point. For a basemap, open `examples/BaseMap.ipynb`. For vector or point data, open `examples/GeoJSON.ipynb`, `examples/KML.ipynb`, or `examples/GPX.ipynb`. The README links to the full documentation at `https://ipyleaflet.readthedocs.io/` and also provides a Binder environment that opens the repository examples in JupyterLab.
The examples cover several interaction paths. `examples/Choropleth.ipynb` is relevant when a map needs a classification layer, while `examples/Heatmap.ipynb` addresses a different visualization model. `examples/DrawControl.ipynb` and `examples/GeomanDrawControl.ipynb` show examples centered on drawing controls. `examples/DropdownControl.ipynb`, `examples/Fullscreen.ipynb`, and `examples/LayerGroup.ipynb` demonstrate that the map can include controls and layer organization rather than only a base map.
The README's animated examples are described as basemaps, GeoJSON maps, Leaflet.js primitives, the splitmap control, velocity data, choropleth layers, and a widget control. These names establish supported example areas, but the README does not provide the full cell contents or explain their data-loading prerequisites. Users should consult the notebook files for the exact code and input assumptions. The project documentation is the authoritative place for the first runnable example.
Operational Limits of the Notebook Bridge
The repository makes the integration boundary visible, but several operational questions remain unanswered in the README. It does not state a browser support policy, a minimum Jupyter or JupyterLab version, a Python version matrix, or a list of supported Leaflet.js versions. It also does not explain how to handle offline tile servers, authentication for external services, or production deployment outside a notebook.
The examples include `CustomTileServer.ipynb`, `ImageService.ipynb`, and `CustomTMS.ipynb`, which show that custom map services are part of the project area. Those filenames do not establish that every external tile service will work, nor do they document service-specific authentication or rate-limit handling. A failure caused by a remote provider would therefore need investigation outside what the README states.
There is also no rollback guide or upgrade compatibility table. The changelog and release files exist in the repository, but their contents are not included in the README. Users moving between releases should inspect `CHANGELOG.md`, `RELEASE.md`, and the relevant package metadata before assuming that notebook behavior is unchanged.
ipyleaflet Compared with Direct Leaflet.js Use
The direct alternative is to use Leaflet.js in a web page and connect it to Python through a separately designed application or communication layer. That approach avoids making the map a Jupyter widget, but it also moves frontend packaging, Python-to-browser messaging, and interface state outside the notebook. ipyleaflet instead supplies the `jupyter-leaflet` frontend package and the `ipyleaflet` Python backend for the Python kernel.
The choice depends on where the map belongs. If the map must behave like notebook output, expose widget controls, and remain close to Python execution, ipyleaflet has the more specific architecture. If the map must be delivered as a standalone web page or integrated into a web application unrelated to Jupyter, direct Leaflet.js is the more direct foundation.
The README does not claim that ipyleaflet improves Leaflet.js performance, reduces data-transfer costs, or replaces every Leaflet plugin. Its documented contribution is the bridge and the associated notebook examples. Any claim beyond that would require evidence from the project documentation or a separate deployment review.
Maintenance Signals and MIT Upgrade Boundaries
The repository is not archived. Its last push was on 2026-05-07, and the recent release list includes `0.20.0` from 2025-06-13, `0.19.2` from 2024-07-22, and `0.19.1` from 2024-05-14. These records indicate recent repository activity and published releases, but the README does not provide a maintenance policy, support window, or detailed upgrade guide.
The upgrade surface is split across the Python package, the `jupyter-leaflet` npm package, and the Jupyter frontend environment. That means installing the Python package alone may not be the complete story for a notebook user. The source instructions separately install `python/jupyter_leaflet` and `python/ipyleaflet`, which reflects that packaging boundary.
The project is licensed under the MIT license. The README refers readers to the `LICENSE` file for details and describes a shared copyright model for contributors. This is a licensing note rather than legal advice. Organizations should review the actual `LICENSE` file and their own distribution obligations before shipping an application built with the project.
Editorial conclusion
ipyleaflet is a sensible choice for Python notebook authors who need Leaflet maps with interactive widget behavior, while it is a poor fit for projects that require a standalone web map without Jupyter. Before adoption, verify that the installed Python package, notebook frontend extension, and Jupyter environment work together, and inspect the `LICENSE` file for the project's MIT licensing terms.
Frequently asked questions
How do I install ipyleaflet in a Python environment?
The README documents `pip install ipyleaflet` as the pip installation route. It also documents installation from `conda-forge` for Conda users.
What is the difference between ipyleaflet and jupyter-leaflet?
The README describes `jupyter-leaflet` as the front-end component and `ipyleaflet` as the Python backend for the Python Jupyter kernel. They are separate packages that work together in the repository architecture.
Where can I find examples for GeoJSON and other map features?
The repository includes `examples/GeoJSON.ipynb`, `examples/BaseMap.ipynb`, `examples/Choropleth.ipynb`, `examples/Heatmap.ipynb`, and other notebooks. The README also links to the full documentation at `https://ipyleaflet.readthedocs.io/`.
Official sources
Add this badge to your README
If you maintain this project, the badge below links readers to this analysis and shows its maintenance status from the daily GitHub snapshot. Paste the markdown into your README; add ?metric=license or ?metric=stars to the image URL for a different field.

[](https://hysenlabs.com/projects/jupyter-widgets-ipyleaflet)Star history chart for your README
[](https://hysenlabs.com/projects/jupyter-widgets-ipyleaflet)Was this useful?