Laravel Brain: the Laravel request lifecycle drawn as a graph
Visualize your Laravel request lifecycle as an interactive graph
At a glance
- What is it?
- Laravel Brain scans a Laravel codebase with static analysis and renders an interactive graph of routes, controllers, jobs, events and the database, served from the application itself at /_laravel-brain. The value is in the edges it finds; the risk is that a static view of code is still a static view.
- Who is it for?
- Adopt Laravel Brain when you have inherited a Laravel application whose structure you cannot hold in your head, especially one with Filament panels, queued jobs and event cascades, and when a graph in the browser is enough to orient you. Do not adopt it as a runtime observability tool, since it reads the codebase statically and cannot show you what actually happened during a request, and treat its complexity and fat class scores as hints rather than measurements.
- Can I use it commercially?
- Not without permission. GitHub finds no licence file in the repository, and without a licence all rights are reserved by default: you may read the code but not reuse it. Check the README, or ask the authors, before using it.
- Is it still maintained?
- Yes. The repository last received commits 51 days ago.
- What is it written in?
- Mainly PHP, according to GitHub's language statistics.
Answers come from the project's GitHub data, last synced on November 7, 2026, and from our analysis. They are not legal advice.
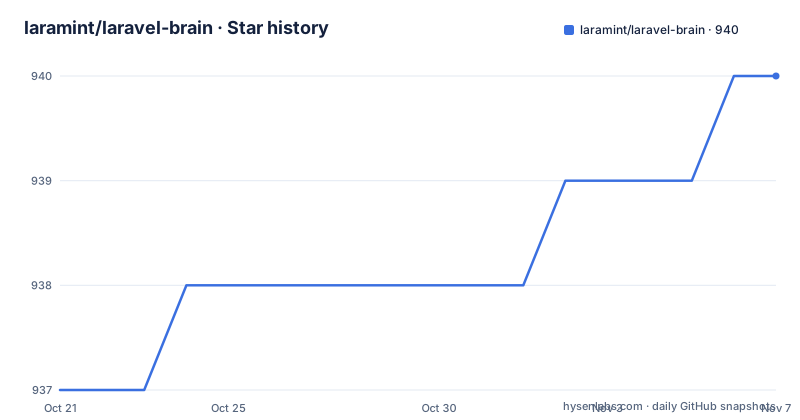
Star history
- laramint/laravel-brain940 ★ · +3
| Repository | 2026-10-21 | 2026-11-07 |
|---|---|---|
| laramint/laravel-brain | 937 | 940 |
3 Stars in the last 17 days, measured from the daily GitHub snapshot. Compare with other projects
Editorial analysis
A scan of the codebase and a viewer inside the app
LaraMint\LaravelBrain is described as a zero-config developer tool that analyses a Laravel codebase and renders an interactive node graph of the application architecture. The claim in the README is that it traces every route through its controller, services, repositories, models, jobs, events, Artisan commands, scheduled tasks, broadcast channels and Filament panels, giving a view of the application without reading the code. Two implementation details define how that works in practice. The scan writes JSON graph files to storage/app/laravel-brain/, so the analysis is a build artefact on disk rather than a live service. The viewer is served at /_laravel-brain entirely through your existing Laravel routes, so there is no separate server process to run and no port to open. The project site is laravel-brain.laramint.dev.
Getting it into a project and running the frontend tools
The repository is a Laravel package, with composer.json, src/, config/, routes/, database/ and resources/ directories at the top level, and the README does not give a one line install command to copy. The package metadata lives in composer.json, and once the package is present in a Laravel application the described behaviour is that the scan and the viewer route need no further setup. What the repository does document in detail is the tooling around the frontend, and those scripts are in package.json:
"dev": "cd frontend && npm run dev",
"build": "cd frontend && npm run build",
"lint": "cd frontend && npm run lint",
"pint": "vendor/bin/pint",
"phpstan": "vendor/bin/phpstan analyse --memory-limit=1G",
"prep": "npm run lint && npm run build && npm run pint && npm run phpstan"
The prep script chains the frontend lint and build with Pint and PHPStan, which tells you what the maintainer expects to pass before a change lands. The docs have their own scripts, docs:dev and docs:build, which build the documentation site in the docs/ directory.
Route to controller to service, one edge at a time
The core tracing follows the shape the framework actually uses. Every route is traced from HTTP verb to controller to service to repository to model to events and jobs, and each route gets its own isolated subgraph tab so you can look at one entry point without the noise of the rest of the application. Around that core sit the mapping features that make the graph readable as architecture rather than a call list. Middleware mapping shows which middleware guards each route, and model relationships display the Eloquent relations such as hasMany and belongsTo. The graph itself is styled with a dark or light theme, accent coloured nodes and interactive edges, and the tool adds method flowcharts so you can step through the internals of a single method rather than only seeing the call chain. The result is closer to a map of the application than a trace of one request.
Event listeners, cascades and dispatches that cannot be resolved
Event handling is where the tool goes beyond a call graph, and it is also where the most interesting failure mode sits. Listeners are found whether they are registered by convention, listed in EventServiceProvider::$listen or $subscribe, or declared with the #[AsEventListener] attribute, and each is linked to the event it handles. A dedicated Events tab traces listener cascades, meaning a listener that fires further events rather than only the single hop from dispatch to handler, and it flags events that have no listener at all. The feature to be careful with is unresolved dispatch detection. A job or event dispatch that cannot be resolved statically, for example because the target is a variable or the result of a factory call, is flagged rather than silently reported as having no impact, and custom dispatch helper functions are recognised too. That distinction matters, since a silent no impact reading would send you looking for code that does not exist.
Jobs, chains and the detail panel behind each node
Queued work is described in the detail panel rather than as extra graph furniture. For a job node the tool shows attempts, timeout, backoff, uniqueness, batching, after-commit dispatch and queue middleware, which is the information you need to answer why a job behaved differently in production than on your machine. Chains and batches are drawn as their own boundaries: jobs dispatched together through Bus::chain(), Bus::batch() or withChain() are grouped, and a chain is drawn with arrows in its run order so the sequence is visible rather than implied. Database related structure is drawn too, with a dashed boundary around every node that runs inside a DB::transaction() closure or a manual begin and commit range, and a rollback path in a catch block bounded separately. The point is that these are the parts of a request that are invisible in a stack trace, and the graph is trying to put them on one screen.
The database is read live rather than inferred from migrations
Several features deliberately read the database instead of reasoning from the code. Table statistics give the row count, estimated or exact, and the table and index size for every model's table, read live from the database. The schema view shows real columns, indexes and foreign keys taken from the database catalogue rather than from migrations, and it flags a foreign key that has no covering index. Morph map aliases are resolved, so the alias that Relation::morphMap() assigns to a model, which is the value that actually lands in a *_type column, is visible, and a model that an enforced map leaves out is flagged. The same live reading approach applies to the outbound side: calls that leave the application through the Laravel HTTP client, Guzzle, curl or file_get_contents are flagged with host, method, timeout and retry, including requests that are built in one class and sent from another. Cache operations are traced per method and split into read, write, invalidate and lock, with the key, and a computed key is labelled rather than guessed.
Filament panels, Artisan commands and the scheduler
Framework specific surfaces are covered rather than left blank. Filament support discovers panels, resources, pages, widgets and relation managers, and traces call chains from Filament page methods the same way controller actions are traced, which is what makes a Filament heavy application readable. Artisan command discovery maps class based commands, closure commands from routes/console.php and commands registered in the Kernel. The scheduler tracing lists every scheduled task, whether it is a command, a job or a call, together with the time it runs, its timezone and its overlap or one-server guards, and those guards are the details that decide whether two replicas collide. Observer discovery finds Eloquent observers declared with #[ObservedBy], registered through Model::observe() or defined in booted(), and links them to the models they observe. Policy resolution goes further, resolving each model's authorization policy through an explicit map, the #[UsePolicy] attribute or a naming convention, then linking that policy into the graph.
Macros, fat classes and where the licence actually stands
A few checks aim at code quality rather than structure. Macro detection finds methods the application adds to existing classes through Macroable::macro() or ::mixin(), including Filament's own Macroable, and draws them as a distinct node kind, so a call like $table->money() is not a dead end when you go looking for where it came from. Fat class detection flags controllers and services with more than 300 lines or more than 10 methods, and cyclomatic complexity is highlighted by tier, Low, Moderate, High or Critical. View composition mapping traces @include, @extends, @component, @each and x-... components as view to view edges, API resource edges trace UserResource::make(), ::collection() and new, and action recognition draws single-purpose action classes filed under Actions/ as their own kind. On maintenance, the versions are recent, with v2.6.0 on 2026-08-31, v2.7.0 on 2026-09-05 and v2.7.1 on 2026-09-18, and the last push to the v2.x branch was on 2026-09-18. The licence field on the repository is listed as unknown even though the README carries an MIT badge, so read the licence terms yourself.
Editorial conclusion
Adopt Laravel Brain when you have inherited a Laravel application whose structure you cannot hold in your head, especially one with Filament panels, queued jobs and event cascades, and when a graph in the browser is enough to orient you. Do not adopt it as a runtime observability tool, since it reads the codebase statically and cannot show you what actually happened during a request, and treat its complexity and fat class scores as hints rather than measurements. Verify first that the version you install matches your Laravel release, since the badges cover Laravel 9 through 13, and check the licence file yourself, because the repository licence field is listed as unknown while the README advertises an MIT badge.
Frequently asked questions
Where does Laravel Brain store the output of a scan?
The scan writes JSON graph files to storage/app/laravel-brain/. The graph is a file on disk in the application rather than a service running beside it.
How do I open the Laravel Brain viewer?
It is served at /_laravel-brain through your existing Laravel routes, so no separate server process is needed. The tool runs inside the application you are already working in.
Which Laravel and PHP versions does Laravel Brain support?
The README badges list Laravel 9, 10, 11, 12 and 13 with PHP 8.0 and above. The default branch of the repository is v2.x.
Does Laravel Brain find event listeners registered with PHP attributes?
Yes. Listeners are discovered whether they are registered by convention, listed in EventServiceProvider::$listen or $subscribe, or declared with the #[AsEventListener] attribute, and each is linked to the event it handles.
How do I run the frontend build and static analysis checks for Laravel Brain?
The package.json scripts run the frontend in the frontend directory with npm run dev and npm run build, and the prep script chains the frontend lint and build with vendor/bin/pint and vendor/bin/phpstan analyse --memory-limit=1G.
Official sources
Add this badge to your README
If you maintain this project, the badge below links readers to this analysis and shows its maintenance status from the daily GitHub snapshot. Paste the markdown into your README; add ?metric=license or ?metric=stars to the image URL for a different field.

[](https://hysenlabs.com/projects/laramint-laravel-brain)Star history chart for your README
[](https://hysenlabs.com/projects/laramint-laravel-brain)Was this useful?