lowlighter/metrics: GitHub activity rendered as profile cards
📊 An infographics generator with 30+ plugins and 300+ options to display stats about your GitHub account and render them as SVG, Markdown, PDF or JSON!
At a glance
- What is it?
- A JavaScript generator with a long plugin list, an official GitHub Action, and a release history that stopped three years before the last commit.
- Who is it for?
- metrics is one of the more capable self-inflicted dashboards in the GitHub profile card space, and its plugin architecture is the reason. Forty seven plugins and a few hundred options is far more surface than a hand written script can offer, and the fact that each plugin documents itself means you can read one before enabling it.
- Can I use it commercially?
- Yes. MIT is a permissive licence: you can use, modify and sell software built on it, as long as you keep its copyright and licence notices.
- Is it still maintained?
- Yes. The repository last received commits 162 days ago.
- What is it written in?
- Mainly JavaScript, according to GitHub's language statistics.
Answers come from the project's GitHub data, last synced on November 7, 2026, and from our analysis. They are not legal advice.
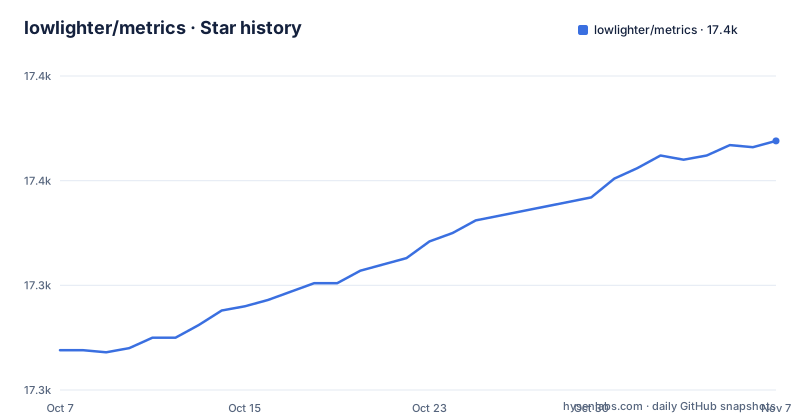
Star history
- lowlighter/metrics17,369 ★ · +100
| Repository | 2026-10-07 | 2026-11-07 |
|---|---|---|
| lowlighter/metrics | 17.3k | 17.4k |
100 Stars in the last 31 days, measured from the daily GitHub snapshot. Compare with other projects
Editorial analysis
What the project actually produces
The repository describes itself as an infographics generator with plugins and options that display stats about your GitHub account and render them as SVG, Markdown, PDF or JSON. That description is accurate about the range and slightly vague about the mechanism, which matters. The real product is a rendering pipeline: it queries the GitHub API for an account, turns the numbers into an SVG layout, and hands you an image you can drop into a profile README.
The README makes the intended location explicit. It opens by saying the metrics can be embedded everywhere, including your GitHub profile readme, and that users, organizations and even repositories are supported. Two things follow from that framing. First, the output is designed to be regenerated on a schedule rather than maintained by hand, which is why it ships as a GitHub Action. Second, the visual language is a card grid rather than a chart library, so the audience is a visitor who lands on a profile page and has about ten seconds.
The hosted site at metrics.lecoq.io is the same generator without the action wrapper, and the badges in the README show a Product Hunt featured listing, which explains a good share of the popularity. The numbers are substantial: roughly 17,200 stars, 2,280 forks and 68 open issues on a JavaScript project whose whole job is decoration.
Three different plugin counts, and why that matters
The most useful thing in the project's own copy is a contradiction, because it tells you something real about how the project describes itself.
The repository description says 30+ plugins and 300+ options. `package.json` carries the same description with a different number, 40+ plugins and 300+ options. The README heading over the plugin gallery says 47 plugins and 335 options. A reader comparing them has no way to tell whether the count grew or whether the copy just drifted.
What the README does do well is link every plugin to its own documentation. The gallery pairs two columns per row, and each entry points at a README under `source/plugins/`, including isocalendar for an isometric commit calendar, languages for language activity, stargazers with classic charts, a graph variant and a world map, lines for lines of code changed, topics for starred topics, stars for recently starred repositories, licenses, habits for coding activity, contributors, and followup for issues and pull requests. Several plugins offer multiple renderings of the same data through collapsible sections, which is a sensible way to show depth without making the card unreadable.
For an evaluator, the practical lesson is that the option surface is genuinely large and genuinely documented, and that you should read the plugin README before turning it on rather than trusting a headline number.
Running it as an action, and what the Dockerfile costs you
Two entry points exist. `action.yml` at the repository root makes this a GitHub Action, and the `start` script in `package.json` points at `source/app/web/index.mjs`, an Express server for local use and for the hosted deployment, with `vercel.json` in the tree confirming that deployment target.
The Dockerfile is where the real weight shows. It starts from `node:20-bookworm-slim`, then installs Google Chrome stable with fonts for major charsets, Deno for miscellaneous scripts, Ruby with the `licensed` gem, and Python for node-gyp. It finishes with `npm ci` and `npm run build`. Two environment variables explain the Chrome arrangement: `PUPPETEER_SKIP_CHROMIUM_DOWNLOAD` is set to true and `PUPPETEER_BROWSER_PATH` points at the system Chrome, so Puppeteer does not download its own browser. There is also a `postinstall` script calling Puppeteer's install script.
That image is heavy, and it is heavy because rendering HTML and SVG to PDF needs a browser. On the GitHub Actions side the cost is paid for you, which is why the action path is the sensible default. Running the Docker image locally is workable but slow to build, so the README's web instance or the action is usually the better first contact for anyone evaluating the project.
One more detail is worth noticing. `package.json` sets the version to `3.35.0-beta`, so the default branch is running a beta that has never been cut as a named release.
Releases stopped in 2023 while commits kept coming
The release history is the part of this project most likely to surprise you, and it is worth reading before you pin a version.
The newest published tag is v3.34, dated 2023-09-13. Before that, v3.33 on 2023-03-28 and v3.32 on 2023-01-18. The last push to the repository was on 2026-05-29, and the default branch is master. So there are roughly three years of commits with no named release, on a repository with 68 open issues and a continuous integration badge in the README.
Architecture, tests and the files worth opening first
The repository is well organised for a project of this size, and the tree tells you where everything lives.
`source/` holds the application and the plugin implementations, which is why plugin documentation lives at paths like `source/plugins/languages/README.md` rather than in a separate docs site. `tests/` holds the Jest suites, and the scripts section of `package.json` shows how they are wired: a general `jest --runInBand` run, plus narrower targets for the continuous integration suite, the presets, and the metrics tests themselves. Linting is `eslint source/**/*.mjs --quiet`.
Three documents at the root are more than boilerplate. `ARCHITECTURE.md` is one of them. `CONTRIBUTING.md` and `CODE_OF_CONDUCT.md` sit alongside `SECURITY.md`, which matters for an action that runs with repository credentials.
`settings.example.json` sits at the root, and the `presets` and `quickstart` scripts run from `.github/scripts/`.
ARCHITECTURE.md
CONTRIBUTING.md
SECURITY.md
action.yml
settings.example.json
vercel.json
Those six entries are the shortest useful orientation for anyone about to modify the project, and each one answers a different question about how it is built, governed and run.
Licensing, rate limits and the questions this tool raises
The licensing is the easy part. GitHub reports the license as MIT, a `LICENSE` file is present in the tree, and `package.json` agrees, so there is no ambiguity here to resolve.
The harder constraints are operational. The project queries the GitHub API extensively for account activity, commit history, repository metadata and language statistics, and the richer plugins go further: the languages plugin can clone and analyze repositories, and the licenses plugin delegates to Ruby's `licensed` gem, which is why the Dockerfile installs Ruby at all. On a scheduled action this works because you control the schedule and hold a token. On a large public dashboard it would be a different conversation about rate limits and fair use.
There is also a philosophical point worth making plainly. A card that counts your commits and plots your stargazers is a self-reported measure of a software career, and the plugins that add isometric calendars, coding habits and a lines of code chart do not change what those numbers mean. The project is honest about being a display tool rather than an evaluation, and the plugin list is broad enough that a reader can build something flattering or something plain depending on which options they choose.
For support, the tree points at GitHub issues for bugs, and `CONTRIBUTING.md` is where a pull request should start. Plugin-specific questions belong in the relevant plugin README, since that is where the options are documented.
Editorial conclusion
metrics is one of the more capable self-inflicted dashboards in the GitHub profile card space, and its plugin architecture is the reason. Forty seven plugins and a few hundred options is far more surface than a hand written script can offer, and the fact that each plugin documents itself means you can read one before enabling it. The costs are real: rendering happens in a headless Chrome, the Dockerfile pulls in Chrome, Ruby, Deno and Python, and the newest published release is v3.34 from September 2023 while the last push landed in May 2026. So the honest picture is a project that is maintained more quietly than its 17,000 stars suggest. Use the GitHub Action, pin to a version you have read the notes for, and treat the plugin list as a capability map rather than a promise of feature parity across releases.
Frequently asked questions
How do I generate metrics cards for my GitHub profile?
Use the project's GitHub Action, which is what `action.yml` at the repository root is for. Add the workflow to your profile repository, and embed the generated metrics in your profile readme. The alternative is the hosted instance at metrics.lecoq.io, which produces the same output through a web interface without a workflow file.
Which version of metrics should I pin to?
The newest published release is v3.34 from 2023-09-13, while the default branch has continued to receive commits, most recently on 2026-05-29, and reports itself as version 3.35.0-beta in package.json. Pin to a tagged release if you want reproducible output, and read the release notes first, because plugin behaviour and option names change between versions.
Why does the metrics project need Docker, Chrome and Ruby?
Rendering to SVG, PDF and Markdown goes through a headless browser, which is why the Dockerfile installs Google Chrome and sets PUPPETEER_BROWSER_PATH while skipping Puppeteer's bundled Chromium download. Ruby is installed for the `licensed` gem that the licenses plugin uses to detect licences in cloned repositories, Deno for miscellaneous scripts, and Python for node-gyp during the install.
How many plugins and options does metrics actually have?
The project's own figures disagree. The repository description says 30+ plugins, package.json says 40+ plugins, and the README heading says 47 plugins and 335 options. The reliable approach is to browse the plugin gallery in the README, where every entry links to its own documentation under source/plugins with the options it accepts.
Official sources
Add this badge to your README
If you maintain this project, the badge below links readers to this analysis and shows its maintenance status from the daily GitHub snapshot. Paste the markdown into your README; add ?metric=license or ?metric=stars to the image URL for a different field.

[](https://hysenlabs.com/projects/lowlighter-metrics)Star history chart for your README
[](https://hysenlabs.com/projects/lowlighter-metrics)Was this useful?