microsoft/Trace: Autodiff-Style Optimization for Prompt and Code Pipelines
End-to-end Generative Optimization for AI Agents
At a glance
- What is it?
- Trace is a Python library that records the execution graph of an LLM agent or code pipeline and then asks an optimizer to rewrite the trainable parts using arbitrary feedback. It is a research implementation with a PyTorch-shaped API, and its fit depends on whether your pipeline can be expressed as node and bundle objects.
- Who is it for?
- Adopt Trace if your pipeline is already Python functions and prompt strings, you can express the mutable parts as trainable nodes or bundles, and you have a feedback signal you can compute per example, whether that is a test case result or a numeric loss. Do not adopt it if you need a stable API with long-term maintenance guarantees, or if your pipeline is mostly a hosted framework you cannot rewrite as plain Python.
- Can I use it commercially?
- Yes. MIT is a permissive licence: you can use, modify and sell software built on it, as long as you keep its copyright and licence notices.
- Is it still maintained?
- Yes. The repository last received commits 151 days ago.
- What is it written in?
- Mainly Python, according to GitHub's language statistics.
Answers come from the project's GitHub data, last synced on November 15, 2026, and from our analysis. They are not legal advice.
Star history
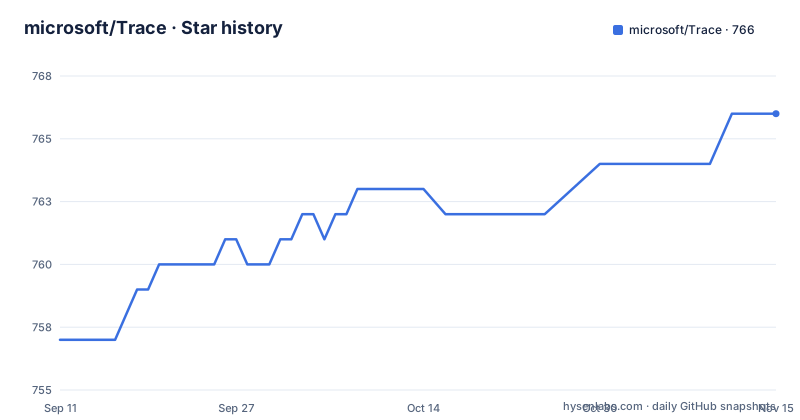
- microsoft/Trace766 ★ · +9
| Repository | 2026-09-11 | 2026-11-15 |
|---|---|---|
| microsoft/Trace | 757 | 766 |
9 Stars in the last 65 days, measured from the daily GitHub snapshot. Compare with other projects
Editorial analysis
The problem Trace targets: optimizing whole pipelines, not just prompts
Most prompt tuning tools treat a prompt as a string to be searched or rewritten. Trace starts from a different unit of analysis: the execution trace of a program. The README describes it as an AutoDiff-like tool for training AI systems end-to-end with general feedback, including numerical rewards, natural language text, and compiler errors. The stated goal is to generalize back-propagation by capturing and propagating a system's execution trace. That framing matters because it decides who the library is for. If your agent is a chain of Python functions where some arguments are prompts, instructions, or code snippets, Trace lets you mark those arguments as trainable and then optimize them against whatever feedback you can compute. If your system lives inside a hosted orchestration product and you cannot express it as Python functions, Trace has nothing to attach to. The intended user is comfortable writing PyTorch-style training loops: declare parameters, run a forward pass, call backward with feedback, call step. The README's own examples are small (a sorting function, a sales agent) and the repository is described as accompanying the Trace paper and containing code to reproduce the experiments reported there. That is a research-artifact posture, and it should shape expectations about API stability.
node and bundle: how the execution graph is actually built
Trace exposes two primitives. A node is a value in the computation graph; a bundle wraps a Python function so it can be optimized. In the README's first example, x = node(1, trainable=True) marks a value as something the optimizer may change, while y = node(3) is fixed. Operations on nodes are traced automatically: z = x / y produces a new node, and the README notes that a plain int such as 3 in x / 3 is converted to a node automatically. Containers are handled too: node([1, 2, 3]) can be appended to, and the README says the library includes magic functions so a node behaves like a normal Python object. Marking trainable=True is the signal that a node's content is fair game for the optimizer. For functions, the @bundle(trainable=True) decorator wraps a Python function, and the README states a bundled function behaves like any other Python function. In the strange_sort_list example the function body is ordinary Python (sorted(lst)), and the docstring describes the intended behavior. The optimizer is not told how to fix the function; it is given the trace and the feedback. There is also a visualization path: z.backward("maximize z", visualize=True, print_limit=25) renders the graph. The mechanism, then, is record-then-rewrite: run the pipeline, capture what happened, hand the trace plus feedback to an optimizer, and let it propose changes to the trainable nodes and bundles.
Installing trace-opt and wiring an optimizer into a training loop
Installation is one command: pip install trace-opt. For development, clone the repository and run pip install -e. The README states the library requires Python >= 3.9, and that Git Large File Storage may be needed if git cannot clone the repository. Backend selection is where version drift shows up. Starting with v0.1.3.5, LiteLLM is the default LLM backend; AutoGen support is kept for backward compatibility and requires the extra tag, as in pip install trace-opt[autogen]. The training loop follows PyTorch conventions. You construct an optimizer over the trainable parameters (optimizer = OptoPrime(strange_sort_list.parameters())), then for each epoch you run the forward pass, compute feedback, and call optimizer.zero_feedback(), optimizer.backward(correctness, feedback), and optimizer.step(). The README's feedback function returns a string, either "test case passed!" or "test case failed!", which is the point of the general-feedback claim: the signal does not have to be a differentiable scalar. For agents, the README shows a @trace.model class with trace.node fields for instructions (for example, trace.node("Decide the language", trainable=True)) and trace.operators.call_llm invoked inside __call__. The README also notes that TextGrad is available as an optimizer in Trace, so OptoPrime is not the only choice.
Where Trace is the wrong tool
The clearest limitation is structural: Trace optimizes what it can trace. If a step in your pipeline is a black box that does not pass through node or bundle, the optimizer cannot see or change it. That rules out pipelines whose logic lives in a hosted platform's configuration rather than in Python you control. A second limitation is the optimizer's dependence on feedback quality. In the README's sorting example, the loop breaks when correctness is true; the optimizer only does work when the test fails. If your feedback is noisy or uninformative, the trace gives the optimizer nothing useful to condition on. Third, the maintenance signal is mixed. The README states the library was implemented and maintained by the authors while they were at Microsoft, which is a past-tense statement about maintenance. The most recent release listed is v0.1.3.8 from 2025-03-23, while the last push to the repository is dated 2026-06-17; that gap between release tags and repository activity is worth checking before you depend on a specific version. Finally, the README's own examples are small and the repository is framed as accompanying a paper. Treat it as a research implementation rather than a production framework, and read the source for anything the documentation does not spell out.
How Trace differs from prompt-only optimizers such as TextGrad
The README lists TextGrad as an optimizer available inside Trace, which makes the comparison concrete rather than abstract. TextGrad optimizes text variables using textual gradients; Trace's contribution is the trace layer underneath. In Trace, the optimizer receives a recorded execution graph, so the thing being optimized is a program with structure: nodes, bundles, and the operations that connect them. That structure is what allows a single feedback signal at the end of a pipeline to be attributed back to specific trainable components, the way back-propagation attributes a loss to weights. A prompt-only optimizer that never sees the graph has to treat the pipeline as a sequence of strings with no recorded dependency structure. The practical difference shows up when a pipeline has multiple trainable parts, as in the sales-agent example with separate instruct1 and instruct2 nodes. Trace's claim is that the trace lets it decide which of those to change. Whether that attribution works better than a text-gradient approach on your task is an empirical question. The README does mention an external paper applying Trace (OptoPrime) to mapper code for parallel programming, reporting a 1.3X speedup learned under 10 minutes; that is the project's own citation of third-party work, not a benchmark you can transfer to your pipeline.
Licence and the cost of keeping up
Trace is MIT licensed, which is permissive and imposes few obligations beyond retaining the copyright and permission notice. That is a genuine advantage for a research artifact: you can vendor it, modify it, or embed it in a commercial pipeline without the licence itself becoming the blocker. The upgrade cost is a separate question from the licence. The README documents one breaking backend change already: v0.1.3.5 made LiteLLM the default LLM backend, and AutoGen support moved behind the [autogen] extra. If your code was written against the AutoGen path, that change requires either installing the extra or migrating to the LiteLLM backend. The release history shows patch-level version numbers (v0.1.3.5, v0.1.3.6, v0.1.3.8) over roughly a month in early 2025, which suggests active iteration during that window rather than a frozen interface. Pin the version you validate against, and check the release notes for backend or optimizer changes before upgrading. This is not legal advice; read the LICENSE file and, if you redistribute, keep the notice intact.
Who should adopt Trace, and what to verify first
Trace fits teams that already write their agent logic as Python functions and want to optimize the mutable parts against a computable signal. The PyTorch-shaped loop is the selling point: if your engineers know zero_grad and step, zero_feedback and step read naturally. It does not fit teams that need a supported product with a compatibility promise, or whose pipeline is defined in a platform they do not control. The honest summary is that Trace is a way to test whether trace-based optimization beats hand-tuning on your specific pipeline, and the repository gives you the code to run that test. Before spending time on it, confirm that pip install trace-opt works on your Python version (>= 3.9), that the optimizer you intend to use is importable from opto.optimizers in the version you install, and that your model provider is reachable through LiteLLM. If all three hold, the smallest useful experiment is the README's own pattern: wrap one function in @bundle(trainable=True), write a feedback function that returns a string or a number, and run two epochs with OptoPrime. If the optimizer cannot improve that single function on your data, the trace layer will not rescue a larger pipeline.
Editorial conclusion
Adopt Trace if your pipeline is already Python functions and prompt strings, you can express the mutable parts as trainable nodes or bundles, and you have a feedback signal you can compute per example, whether that is a test case result or a numeric loss. Do not adopt it if you need a stable API with long-term maintenance guarantees, or if your pipeline is mostly a hosted framework you cannot rewrite as plain Python. Before committing, verify three things against the repository: that pip install trace-opt resolves on your Python version, that the optimizer you want (OptoPrime, or TextGrad as an alternative optimizer) is exported from opto.optimizers in the release you install, and that your LLM backend is reachable through the LiteLLM path, since the README states LiteLLM became the default backend starting with v0.1.3.5 and AutoGen support now requires the [autogen] extra.
Frequently asked questions
What is Trace and what does it optimize?
Trace is a PyTorch-like Python library for training AI systems end to end from general feedback such as rewards, natural language text or compiler errors. Instead of gradients it captures and propagates an execution trace, and the code being optimized is ordinary Python, including agent prompts.
How do I install Trace, and what is the package called?
Install trace-opt with pip, or pip install -e . from a clone for development. The project is Trace, the distribution is trace-opt, and the import namespace is opto, so the code samples use paths such as opto.trace for the node and bundle primitives and opto.optimizers for OptoPrime.
Which LLM backend does Trace use by default?
LiteLLM, starting with version 0.1.3.5. AutoGen remains supported for backward compatibility and is installed through the autogen extra, which pins autogen-agentchat to exactly 0.2.40, so the legacy path cannot move past that version.
How does Trace take an optimization objective?
You pass an English objective to a backward-style call, for example z.backward("maximize z", visualize=True, print_limit=25), and you mark what the optimizer may rewrite with node(1, trainable=True) or the @bundle(trainable=True) decorator. The optimizer is OptoPrime, constructed from the parameters of the bundled function or model.
What are the current Trace releases and how recent is the code?
The three most recent tags are v0.1.3.5, v0.1.3.6 and v0.1.3.8, the last published 2025-03-23. The default branch was pushed to on 2026-06-17, so a clone and a pip install are not the same code, and the version itself is read at build time by executing opto/version.py.
Official sources
Add this badge to your README
If you maintain this project, the badge below links readers to this analysis and shows its maintenance status from the daily GitHub snapshot. Paste the markdown into your README; add ?metric=license or ?metric=stars to the image URL for a different field.

[](https://hysenlabs.com/projects/microsoft-trace)Star history chart for your README
[](https://hysenlabs.com/projects/microsoft-trace)Was this useful?