react-native-performance: a Performance API for React Native, and where to look at it
📐 Monitor and measure React Native performance
At a glance
- What is it?
- React Native Performance is a toolchain that brings the web Performance API to React Native, with packages for tracing render events, network traffic and native startup metrics, plus an isomorphic variant for apps that also target the web. The interesting wrinkle is on the viewing side: with Flipper deprecated, the metrics land in Rozenite instead.
- Who is it for?
- React Native Performance fits a team that has already decided performance matters and wants one API across native and web, with measurements that cover the native startup path and not just React renders. It does not fit a team that wants a profiling tool with no third-party viewer attached, because the Flipper dependency is gone and the README points at Rozenite as the current replacement.
- Can I use it commercially?
- Yes. MIT is a permissive licence: you can use, modify and sell software built on it, as long as you keep its copyright and licence notices.
- Is it still maintained?
- Yes. The repository last received commits 56 days ago.
- What is it written in?
- Mainly TypeScript, according to GitHub's language statistics.
Answers come from the project's GitHub data, last synced on November 7, 2026, and from our analysis. They are not legal advice.
Star history
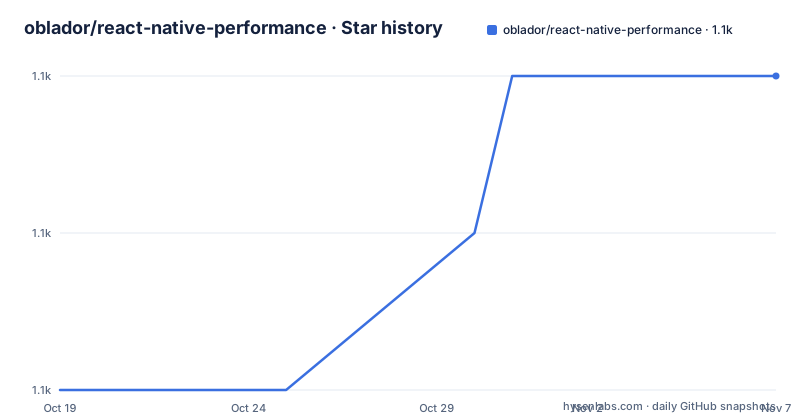
- oblador/react-native-performance1,064 ★ · +2
| Repository | 2026-10-19 | 2026-11-07 |
|---|---|---|
| oblador/react-native-performance | 1.1k | 1.1k |
2 Stars in the last 19 days, measured from the daily GitHub snapshot. Compare with other projects
Editorial analysis
The web Performance API, ported to a platform that does not have one
React Native Performance is described as a toolchain to measure and monitor the performance of your React Native app in development, pipeline and in production.
The central idea is familiar if you have worked on the web. Browsers have the Performance API, and the react-native-performance package is an implementation of it for React Native, so the same measurement vocabulary works on a platform that does not ship one. The package list in the README is short and describes the scope well: it integrates well with the React.Profiler API, it can trace arbitrary events in your app such as component render time, it can capture network traffic, it can collect native traces such as script execution and time to interactive of root view, and it can collect native metrics in development such as JS bundle size.
That last item is the one that changes what a team can answer. JS bundle size measured in development is a number that appears in code review conversations and in release checklists, and a tool that reports it as part of the same measurement stream as render times puts two different kinds of regression in the same place.
The project is MIT licensed, with the README credit reading MIT © Joel Arvidsson 2019 to present, and the version 7.0.0 was published on 2026-09-13, the same day as the last push to the repository. The previous major, v6.0.0, came on 2025-10-23, and v5.1.4 on 2025-06-15, so a major version roughly once a year and patch releases in between.
Two packages, and the second one exists for web targets
The monorepo publishes two packages and the split between them is the design decision worth understanding.
The react-native-performance package is the native one, the Performance API implementation for React Native described above. The isomorphic-performance package is an isomorphic Performance API for Node, Browser and React Native, and the README says it is useful if your app targets both web and native.
That second package exists because of a specific failure mode. A codebase that ships a web version and a native version of the same application ends up with two measurement implementations, two sets of marks, and a reporting pipeline that only understands one of them. Sharing one API means the same measurement call compiles and behaves the same in both environments, so the numbers are comparable.
The cost is that the isomorphic package is the constrained one. An API that has to work in Node, in a browser and in React Native cannot expose the native-specific extensions, so the native-only features, the native traces and the development metrics stay in the react-native-performance package, and code that uses them will not compile in a web build. A team that has both targets needs to decide which API surface it treats as portable, and that decision has to be made per measurement, not once.
The repository is a Yarn workspaces monorepo, with lerna.json at the root and the workspace globs set to examples/* and packages/*, so an example application and a published package sit in the same tree and are versioned together.
Where the numbers are read: Flipper is gone
The Devtools integration section is short and it explains the single most important operational fact about this project today.
With Flipper deprecated, the best replacement is currently Rozenite, which supports react-native-performance out of the box with an official plugin for the performance monitor.
That sentence contains three separate claims. The first is that Flipper, which was the standard React Native desktop debugger and the natural home for this kind of metric stream, has been deprecated by its own maintainers. The second is that the project has not been abandoned with it, because the measurements still work and are exposed through a different client. The third is that the replacement is a third-party project with its own plugin for the performance monitor, which means the viewing half of the workflow now depends on a tool whose own roadmap is not controlled by the author of this library.
For a team that had Flipper in its development workflow, that is a change to make. The instrumentation is the same, but the place you look at the results is a different application, installed separately, with a plugin that has to be present for the performance data to be visible.
There is a second consequence worth stating. The README's opening sentence says the toolchain measures and monitors performance in development, in pipeline and in production. The development and pipeline cases are the obvious ones, and a monitoring client in the loop suits them. The production case is a different shape of problem, since a production device is not running a desktop debugger, and the README does not describe where production measurements go. That part of the claim is the part to read the package documentation for.
The toolchain is older than the framework it measures
The root package.json is worth reading as a document, because it describes a project in transition.
On one side, the React and React Native versions are current: react 19.2.3 and react-native 0.87.1 as development dependencies. On the other, the tooling is from an earlier era: lerna 3.20.2, prettier 2.8.8, and a packageManager field pinning [email protected] with a hash. The README is explicit that you need yarn v1 installed and that you run yarn in the root folder to install dependencies for all packages.
That combination is not necessarily a problem. Yarn classic with workspaces and Lerna 3 is a stable, well understood setup, and a library that must support a range of consumer toolchains has a reason not to modernise its own. But it does have consequences for anyone building on it. If your organisation has moved to Yarn 2 or later, the workspaces here do not apply as they are, and the resolutions block that pins @types/react to an older range is a sign that the root install is not going to merge cleanly with a modern setup without work.
The scripts themselves are simple and instructive. The build runs a prepare in the react-native-performance workspace, and a postinstall hook runs that build, so installing the repository's dependencies also builds the package. The test script delegates to the react-native-performance workspace, and the types script runs tsc with no emit twice, once for the root project and once for the package's own build configuration.
  "scripts": {
    "build": "yarn workspace react-native-performance prepare",
    "postinstall": "yarn build",
    "test": "yarn workspace react-native-performance test",
    "types": "tsc --noEmit && tsc --noEmit -p packages/react-native-performance/tsconfig.build.json"
  },
Running the example and the tests
The development instructions in the README are the shortest path to seeing the tool work, and they contain one ordering constraint that matters.
First, make sure you have yarn v1 installed and run yarn in the root folder to install dependencies for all packages. Then run the example app:
cd examples/vanilla
yarn start # important to run this before the next step!
yarn ios # or yarn android
The comment on the yarn start line is the kind of thing that saves an hour. The bundler or the development server has to be running before the native app is launched, because the measurement plugin is loaded by the JavaScript bundle that yarn start produces. Launching the app first gives you an app with no instrumentation and no error to explain why.
The unit tests are one command from the root:
yarn testThe examples directory holds two applications, vanilla and web, which is a good structural hint about the scope of the two packages. The vanilla example is the native one, and the web example exists because of the isomorphic package, and it is where you would check that a measurement behaves the same in a browser build.
The repository also carries .node-version and .tool-versions files, a .watchmanconfig, a .prettierrc with a matching .prettierignore, and a check-format script that runs Prettier in check mode over the markdown, JavaScript, TypeScript and JSON across packages and examples. For a library that other people's tooling will read, having the formatting enforced rather than suggested is a small sign of care.
Editorial conclusion
React Native Performance fits a team that has already decided performance matters and wants one API across native and web, with measurements that cover the native startup path and not just React renders. It does not fit a team that wants a profiling tool with no third-party viewer attached, because the Flipper dependency is gone and the README points at Rozenite as the current replacement. Before you adopt it, check the major version you are on against the v7 release, and confirm that the devtools client you plan to use exposes the performance plugin, since the measurement side and the viewing side now live in different projects.
Frequently asked questions
What does react-native-performance actually measure?
It implements the Performance API for React Native and can trace arbitrary events such as component render time, capture network traffic, collect native traces such as script execution and time to interactive of the root view, and collect native metrics in development such as JS bundle size. It also integrates with the React.Profiler API.
What is isomorphic-performance for?
It is an isomorphic Performance API for Node, Browser and React Native, and the README says it is useful if your app targets both web and native. The native-specific features stay in the react-native-performance package.
Which devtools should I use with react-native-performance?
The README says that with Flipper deprecated, the best replacement is currently Rozenite, which supports react-native-performance out of the box with an official plugin for the performance monitor.
How do I run the react-native-performance example app?
Run yarn in the root folder to install dependencies, then cd examples/vanilla and run yarn start before launching the app with yarn ios or yarn android. The README marks running yarn start as important before the next step, because the app is instrumented by the JavaScript bundle it produces.
What licence is react-native-performance released under?
MIT, credited in the README as MIT © Joel Arvidsson 2019 to present, with the LICENSE file in the repository root and the license field set to MIT in the root package.json.
Official sources
Add this badge to your README
If you maintain this project, the badge below links readers to this analysis and shows its maintenance status from the daily GitHub snapshot. Paste the markdown into your README; add ?metric=license or ?metric=stars to the image URL for a different field.

[](https://hysenlabs.com/projects/oblador-react-native-performance)Star history chart for your README
[](https://hysenlabs.com/projects/oblador-react-native-performance)Was this useful?