otel eBPF profiler: no agents, no restarts, no debug symbols
The production-scale datacenter profiler (C/C++, Go, Rust, Python, Java, NodeJS, .NET, PHP, Ruby, Perl, ...)
At a glance
- What is it?
- A whole-system profiler for Linux that unwinds native code and language runtimes from the kernel outward without touching the processes it measures. The overhead budget, the kernel floor, and the warning attached to the standalone binaries are the three things worth reading first.
- Who is it for?
- This profiler fits a production Linux host where you cannot restart interpreters, cannot ask developers to ship debug symbols, and cannot afford to instrument anything by hand. Two things to verify before rollout.
- Can I use it commercially?
- Yes. Apache-2.0 is a permissive licence: you can use, modify and sell software built on it, as long as you keep its copyright and licence notices.
- Is it still maintained?
- Yes. The repository received new commits within the last day.
- What is it written in?
- Mainly Go, according to GitHub's language statistics.
Answers come from the project's GitHub data, last synced on November 14, 2026, and from our analysis. They are not legal advice.
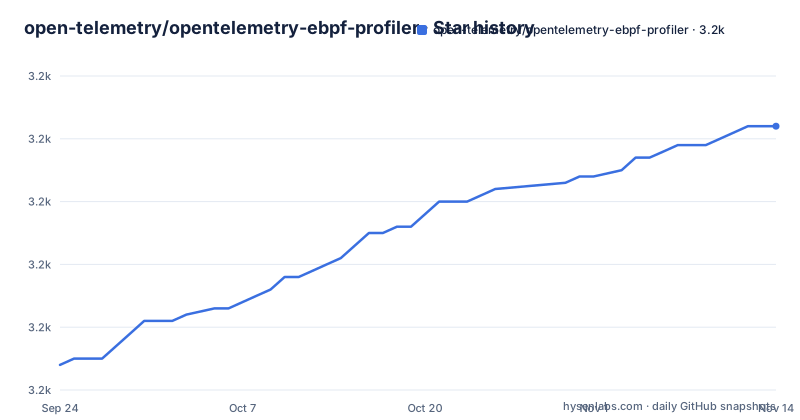
Star history
- open-telemetry/opentelemetry-ebpf-profiler3,232 ★ · +38
| Repository | 2026-09-24 | 2026-11-14 |
|---|---|---|
| open-telemetry/opentelemetry-ebpf-profiler | 3.2k | 3.2k |
38 Stars in the last 51 days, measured from the daily GitHub snapshot. Compare with other projects
Editorial analysis
Nothing is loaded into the process being measured
The design claim is non-intrusion, and the consequences of it run through the whole feature list. Nothing is injected into profiled processes: no agent, no library. That is what makes the rest possible, because it also means no reconfiguration, no instrumentation, and no restart of any interpreter or virtual machine, and the agent unwinds every supported language in its default configuration rather than asking you to enable something per runtime. The unwinding is done without debug information in two separate cases. Native executables work without DWARF data, because the profiler reads exception-handling frame data instead, which is a technique the project credits to a named patent. System libraries work without frame pointers and without debug symbols present on the host. Because of that, a stacktrace can cross from kernel space, through unmodified system libraries, and into a managed language in one continuous chain, which is the whole-system part of the name.
The overhead budget is stated as a ceiling, not a target
The performance line is unusually specific and worth quoting exactly, because the phrasing is the argument. One percent CPU and 250 megabytes of memory are described as upper limits observed in testing, with the note that the agent typically manages to stay way below that. So the numbers are a bound the authors hold themselves to rather than a benchmark result, and the claim is about the agent's own cost, not about how fast the profiled workload runs. Two other items in the feature list matter for precision rather than speed. All unwinders support 64-bit ARM, and native inline frames are handled, which the documentation says gives insight into what the compiler did and yields higher-precision call chains. The runtime coverage list names the HotSpot virtual machine, Python, Ruby, PHP, Node and V8, Perl, Erlang, and the .NET runtime, with native code covered separately for C, C++, Rust, Zig, and Go.
The kernel floor follows distribution support lifetimes
The minimum kernel is not arbitrary, and the repository tracks it with two named commits so you can tell whether your host is too old. One commit was the last to support kernel 5.4, and anything after it may need 5.10 or newer. An earlier one was the last to support 4.19, with a floor of 5.4 beyond it. The stated policy is to keep the minimum aligned with the lowest kernel currently shipped by actively maintained major distributions, naming Debian stable, Red Hat Enterprise Linux, Ubuntu long-term support, Amazon Linux, and SUSE, and to raise it only once none of them ship that version. The reasoning is given too: it lets the code use newer eBPF features and avoids carrying compatibility shims for kernels nobody ships. One escape hatch exists for the awkward case.
Backported features make the version number lie
There is a caveat that will save somebody an afternoon. Distributions backport kernel features, so the version a distribution reports does not reflect its actual eBPF capabilities. A host running an older numbered kernel may therefore support everything the profiler needs, and the check would refuse to start it anyway. The configuration option named for that case exists to bypass the version check and let the agent run on such a kernel. The practical reading is that a refusal to start is not proof of incompatibility, and the first thing to try is the bypass rather than a kernel upgrade. The stated signal being implemented is the profiles signal, which is described as an alpha in the specification repository, and the agent's implementation of it is described as functional but still evolving.
The supported deployment is a collector receiver
The profiler has been integrated into the OpenTelemetry Collector as a receiver, and the documentation is explicit that this collector distribution is the supported configuration going forward. Two other binaries exist for convenience and carry a warning worth repeating: the standalone agent and a locally built collector binary are described as not supported in any way, as able to be dropped in the future, and as not to be deployed in production. Building is done with make targets, and Docker is required for containerised builds, with both 64-bit architectures supported.
make agent
# or, for another architecture
make agent TARGET_ARCH=arm64
The resulting binary is named ebpf-profiler and lands in the current directory. Because the profiler is Linux-only, macOS and Windows developers are told to set up a Linux virtual machine and use the same targets once it is configured. There is also a path that skips Docker by installing the dependencies listed in the Dockerfile and running the default target, and a separate target that builds the local collector binary, with an example configuration file shipped beside it.
Running it takes root, a collector address, and a feature gate
Two commands cover the two deployment shapes. The standalone agent takes the address of a collection agent and a flag that turns off transport security.
sudo ./ebpf-profiler -collection-agent=127.0.0.1:11000 -disable-tlsThe collector binary instead takes a feature gate for the profiles support and a configuration file.
sudo ./otelcol-ebpf-profiler --feature-gates=+service.profilesSupport --config cmd/otelcol-ebpf-profiler/local.example.yamlRoot is required in both cases, which follows from what the agent does: it loads an eBPF program and its maps, starts unwinding, and reports the captured traces onwards. The disable flag on the standalone binary is worth noting for anything beyond a laptop, since it turns off transport security between the agent and whatever collects the data.
Two backends, and one says it is not a backend
Because the signal is still in development, the documentation says plainly that mature production-ready backends have yet to emerge, and then lists two. One is a desktop application that reimplements the backend half of this project, covering collection, storage, symbolisation, and a user interface, and its own entry states that it is not a real production backend and should not be used as one, being aimed only at testing, experimentation, and development. The other is a continuous profiling database that natively supports ingesting this telemetry format. The distinction is the useful part: one gets you a working pipeline today for development, the other is the candidate for production. The repository itself is organised to match that split, with per-language interpreter directories, a native unwinder, symbol table handling, and an instrumentation directory, all sitting alongside the collector integration.
Editorial conclusion
This profiler fits a production Linux host where you cannot restart interpreters, cannot ask developers to ship debug symbols, and cannot afford to instrument anything by hand. Two things to verify before rollout. Confirm your kernel is new enough, or use the bypass option if your distribution backports the features you need despite an older version number. And pick your backend deliberately, since the signal is still alpha and one of the two open source options is explicitly not meant for production use.
Frequently asked questions
What does the OpenTelemetry eBPF profiler do?
It is a whole-system, cross-language profiler for Linux built on eBPF. It unwinds native code and language runtimes into continuous stacktraces that run from kernel space through unmodified system libraries into high-level languages, without loading anything into the processes being profiled.
Does the eBPF profiler need agents or debug symbols?
No. Nothing is injected into profiled processes, so there is no agent or library to install and no interpreter or virtual machine to reconfigure or restart. Native executables work without DWARF information, and system libraries work without frame pointers and without debug symbols on the host.
Which Linux kernel versions does the eBPF profiler support?
The floor is tracked against what actively maintained distributions still ship, and two commits mark the boundaries: the last supporting kernel 4.19 and the last supporting kernel 5.4, beyond which later changes may require 5.10 or newer. Distributions that backport eBPF features can run with the no-kernel-version-check option to bypass the check.
Which backend should the eBPF profiler send data to?
The documentation lists two open source options and is blunt that mature production backends have not appeared yet. One desktop application reimplements collection, storage, symbolisation, and the interface for development and experimentation, and states it should not be used in production. The other is a continuous profiling database that natively ingests this format.
Official sources
Add this badge to your README
If you maintain this project, the badge below links readers to this analysis and shows its maintenance status from the daily GitHub snapshot. Paste the markdown into your README; add ?metric=license or ?metric=stars to the image URL for a different field.

[](https://hysenlabs.com/projects/open-telemetry-opentelemetry-ebpf-profiler)Star history chart for your README
[](https://hysenlabs.com/projects/open-telemetry-opentelemetry-ebpf-profiler)Was this useful?