flood-map is a 2015 Chennai crowdsourcing map still published from its gh-pages branch
A simple web map to visualize flood information on maps
At a glance
- What is it?
- A web map built on OpenStreetMap and Mapbox GL JS that visualises Chennai flooding from UNOSAT and ISRO satellite layers plus crowdsourced street reports, where public contributions are anonymous and deliberately unversioned. The durable output is a dated geojson dump, and the deployment target is the default branch itself.
- Who is it for?
- This map earns its place as a case study in crowd-sourced disaster mapping rather than as a map you would consult today. What it demonstrates well is the shape of the exercise: a plain OpenStreetMap base, authoritative satellite layers for inundation, a spreadsheet of relief centres, a news report for waterlogged roads, and a public layer of street reports on top, all dated so you can see which picture came from when.
- Can I use it commercially?
- Yes. MIT is a permissive licence: you can use, modify and sell software built on it, as long as you keep its copyright and licence notices.
- Is it still maintained?
- Probably not. The repository last received commits 34 months ago, on December 8, 2023.
- What is it written in?
- Mainly HTML, according to GitHub's language statistics.
Answers come from the project's GitHub data, last synced on October 20, 2026, and from our analysis. They are not legal advice.
Star history
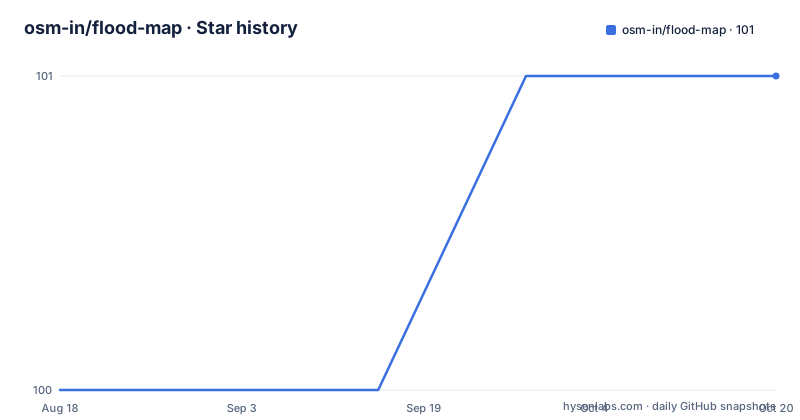
- osm-in/flood-map101 ★ · +1
| Repository | 2026-08-18 | 2026-10-20 |
|---|---|---|
| osm-in/flood-map | 100 | 101 |
1 Stars in the last 63 days, measured from the daily GitHub snapshot. Compare with other projects
Editorial analysis
Contributions are anonymous and there is no version control
The flooded streets layer is the part people add to, and the design decision there is stated without hedging: contributions from the public are anonymous, with no version control, for the sake of simplicity. That is an unusual choice in a repository that lives on GitHub, where a pull request is the normal route for a change. Here the map is the interface, a resident marks a street on the map and the marker goes into the layer, with no account and no record of who did it. The trade is speed against accountability: during a flood the priority is getting the reports in, and requiring a login would lose the people who need it most. The cost is that a bad report cannot be traced or quietly reverted, which is why the README pushes the collected data out as a dump rather than asking anyone to trust the live layer.
Inundation comes from two satellite passes, dated November 28 and December 3
The authoritative layers are grouped as vulnerable and inundated areas, and each has a date attached, which is what makes the map a record rather than a single verdict. Inundated areas for November 28 come from Flood Waters Over Chennai Area published by UNITAR and UNOSAT. Inundated areas for December 3 come from ISRO RISAT 1, served as a Mapbox Studio dataset. Low lying locations come from ISRO Cartodem 3, downloadable from Bhuvan, and from SRTM 30m elevation data through EarthExplorer. Because the two inundation snapshots are five days apart, someone reading the map can compare them and see water present in one and absent in the other, which is more informative than either layer alone. The elevation sources are the reason the map can talk about low lying ground at all, since that is a terrain question rather than an imagery one.
Relief camps came from a spreadsheet and roads from a news report
Two of the layers did not come from a geospatial dataset, and the README is straightforward about where they did. Flood relief camp locations are credited to Chennai Flood Relief Centres Crowdmapping, and the link behind that entry resolves to a shared Google spreadsheet rather than to a file in this repository, so the layer depends on a document that can be edited by anyone with the URL. Waterlogged Roads are credited to The NEWSminute, with the link pointing at the outlet's article on a wire show that maps waterlogged areas. Both choices make sense for a response effort measured in hours, and both have an obvious cost: the layer and its source can drift apart without anyone noticing. It is also the clearest illustration of the map's philosophy, that a named human source beats an anonymous one even when the human source is a spreadsheet.
The geojson dump is the artefact worth keeping, and it is dated December 2 2015
The README encourages reuse of the collected data for further analysis, and points at two ways in. The current layer is fetched as geojson through an Ajax request whose implementation lives in a JavaScript file, with the relevant line range linked directly into the source. And there is a snapshot committed to the repository, dated 11AM Dec 2, 2015, as a geojson file under the data directory. That single snapshot matters more than it looks, because the live layer has no version history: this file is the only fixed point where the crowdsourced reports can be compared across time. If you want to study how street-level reporting behaved during that flood, this file and the date attached to it are the reason the repository is still worth having, even though nothing else in it has been updated in a decade.
The default branch is gh-pages, so the repository is the deployed site
The branch structure is the first thing to understand about this project, because it explains most of what is missing. The default branch is gh-pages, which is the branch GitHub Pages serves, so the repository is not a source tree that gets built into a site but the site itself, committed directly. That is why the top level is what you would expect to find in a published web root rather than in a project: index.html, chennai.html and cuddalore.html as the city pages, 404.html, crossdomain.xml, browserconfig.xml, robots.txt, an apple-touch-icon.png, and the css, img, js and data directories. Two cities have their own page, which tells you the template was built to be duplicated per event. There is no package manifest, no build configuration and no deployment script, so the contribution instructions go straight to serving the directory.
Local testing is three commands and a port, with no dependencies to install
The contribution section is brief and practical. It asks people to look at the open issues and submit pull requests that fix them, then explains how to test the source locally, and the whole procedure is:
npm install -g serve
serve -p 3001
Running the map on your browser at localhost:3001
So there is exactly one tool involved, a static file server installed globally, and the map is then opened in a browser on port 3001. There is an .eslintrc at the top level, which suggests the JavaScript under js is linted, but no npm manifest and no package scripts, so the linting is run by whatever the contributor has installed rather than by the project. That combination is consistent with the whole repository: it is a hand-maintained static site, and the only build requirement is a web server.
MIT licensed, published over http, last pushed December 2023
The licensing is MIT in a file named LICENSE.txt, and the project is not archived. The last push to the default branch is dated 2023-12-08, which is more recent than the data would suggest and much less recent than the project needs: the layers describe Chennai flooding in late 2015, so a 2023 commit is a repository that got tidied rather than a map that got updated. The homepage is served over plain http at osm-in.github.io/flood-map, not https, which is a small thing worth noting if you link to it from anywhere that enforces https. The README also credits two upstream sources for the presentation layer, HTML5 boilerplate for the page scaffolding and Mapbox base.css for the styles, and names three tools the project depends on: Mapbox Studio for the datasets, Mapbox GL JS for the map itself, and the Mapbox Dataset API. The press coverage it links is from The Hindu and the Times of India.
Editorial conclusion
This map earns its place as a case study in crowd-sourced disaster mapping rather than as a map you would consult today. What it demonstrates well is the shape of the exercise: a plain OpenStreetMap base, authoritative satellite layers for inundation, a spreadsheet of relief centres, a news report for waterlogged roads, and a public layer of street reports on top, all dated so you can see which picture came from when. Two limits decide how you use it. The default branch is gh-pages, meaning the repository is the deployed site rather than a source tree, so there is nothing to fork into a build pipeline without moving it first. And the last push is dated 2023-12-08 while the data itself is from late 2015, so treat every layer as a historical snapshot. If you want the street reports, take the geojson dump and do your own analysis on it.
Frequently asked questions
What is a flood inundation map?
In this project it is a web map layering inundation over OpenStreetMap. Two dated snapshots come from satellite sources, UNITAR and UNOSAT for November 28 and ISRO RISAT 1 for December 3, with low lying ground derived from ISRO Cartodem 3 and SRTM 30m elevation data, and a crowdsourced layer for flooded streets on top.
How do you use the flood map in this repository?
It is a web page, so you open it in a browser. For local work the documented steps are to install serve globally, run it on port 3001 and open localhost:3001, which serves the repository directory directly because the default branch is gh-pages and the committed files are the site.
How do you read a flood map?
This map is read layer by layer rather than by zone designation. Each layer has a named source and, where relevant, a date, so you compare the November 28 and December 3 inundation layers, treat the crowdsourced street reports as reports rather than measurements, and remember the relief camp layer comes from a shared spreadsheet and the waterlogged roads layer from a news report.
What is a floodplain in simple terms?
The repository does not use the term. What it works with instead is elevation data, since low lying locations are derived from ISRO Cartodem 3 and SRTM 30m data, together with satellite imagery of where water actually was on two specific dates in December 2015.
Official sources
Add this badge to your README
If you maintain this project, the badge below links readers to this analysis and shows its maintenance status from the daily GitHub snapshot. Paste the markdown into your README; add ?metric=license or ?metric=stars to the image URL for a different field.

[](https://hysenlabs.com/projects/osm-in-flood-map)Star history chart for your README
[](https://hysenlabs.com/projects/osm-in-flood-map)