Deneb: a gallery of Vega charts built inside Power BI
A collection of advanced dataviz examples using Vega, Vega-Lite, Deneb and Power BI.
At a glance
- What is it?
- The Deneb Showcase is a directory of advanced data visualisation examples written in Vega and Vega-Lite and rendered through Deneb inside Power BI, covering convex hulls, arc charts, animated maps, Sankey diagrams, gantt charts and unit charts. Every example ships with a thumbnail and a link to an editable online spec, and the repository is MIT licensed.
- Who is it for?
- Adopt this gallery if you build Power BI reports and have hit the ceiling of the built-in visuals, because each example is a working Vega specification you can open, read and adapt rather than a screenshot of an idea. Do not adopt it as a component library, because there is no package to install and no code to call, it is a gallery of specifications and a record of what is achievable.
- Can I use it commercially?
- Yes. MIT is a permissive licence: you can use, modify and sell software built on it, as long as you keep its copyright and licence notices.
- Is it still maintained?
- Yes. The repository last received commits 44 days ago.
- What is it written in?
- Mainly JavaScript, according to GitHub's language statistics.
Answers come from the project's GitHub data, last synced on November 7, 2026, and from our analysis. They are not legal advice.
Star history
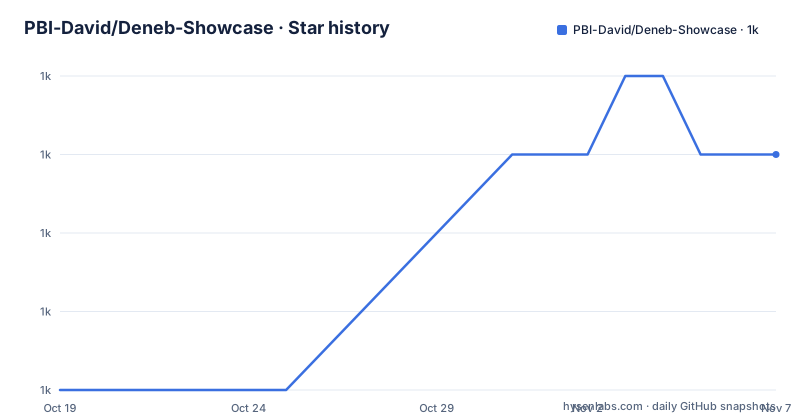
- PBI-David/Deneb-Showcase1,022 ★ · +3
| Repository | 2026-10-19 | 2026-11-07 |
|---|---|---|
| PBI-David/Deneb-Showcase | 1k | 1k |
3 Stars in the last 19 days, measured from the daily GitHub snapshot. Compare with other projects
Editorial analysis
What the collection is, and what it is not
The project describes itself as a collection of advanced dataviz examples using Vega, Vega-Lite, Deneb and Power BI, and it makes a point about provenance: all the work is original and where it has been inspired by the work of others, that has been pointed out. That credit is specific and traceable rather than decorative, with Mike Bostock named for the calendar heatmap, Daniel Shiffman for the animated bubble text and fireworks, the Flerlage Twins for the Mario bubble art, and Chris Webb's base64 image handling code for the organisation tree chart. The audience is a Power BI author who has run into the limits of the built-in chart types and wants to see what a declarative grammar can do, and the delivery format is a directory per example, each with a thumbnail image and a link to an online editor where the specification can be opened and modified. The examples are the documentation. There is no package to install, no API to call, and no runtime component, which is both the strength and the limit of the thing.
The certified-visual constraint, and the topojson workaround
One entry carries a warning that is really a lesson about the environment these charts run in. The Covid Map is an animated map built in Vega showing the spread of Covid-19 across the UK using data from the UK coronavirus data site, and the note explains that topojson can be a bit tricky to get working in the certified Deneb visual because no loading from external sources is allowed, and that the accompanying .pbix shows how it can be done by embedding the topojson inline. That single paragraph explains most of the design decisions in the collection. A certified visual in Power BI has no network access, so a specification that fetches a topology at runtime simply fails, and the author has to inline the data instead. The online editor link is the companion to that, because the browser-based editor has no such restriction, and it is where you can see the spec before it is adapted to the Power BI environment. For the bank failure bubble chart, the editor for the absolute figures is at:
https://evyb.short.gy/jYyw96Charts you would not attempt with a built-in visual
Several entries exist purely because Vega can express them and a chart library in a reporting tool cannot. The Convex Hull is an implementation of the Graham Scan algorithm for a convex hull using only transforms and signals in Vega, with no geometry library involved, which is the sort of thing that shows what a declarative grammar is for. The Coronation Arc Chart is a visualisation made in Vega and Power BI for the coronation of Charles III, and an arc chart is not a shape that most reporting tools offer as a type. The Mekko Chart is a bar chart of global military spending in 2022 using data from SIPRI, and the README explains the two flavours, a Mekko bar chart where the y-axis acts like a normal stacked bar chart but with a normalised x-axis so you can see the proportion taken by each major segment, and a Marimekko chart where both axes are normalised. The Organisation Tree Chart adds hierarchical navigation with colour coded branches, expandable nodes, profile photos, zooming and panning, and the Pancake Spider Chart is a faceted spider chart built from a BBC Good Food pancake recipe dataset that was the winning submission to a competition, with the note that in Vega each axis can have its own scale, which is essential for comparing different dimensions.
Three tiers of interaction in one gallery
Read across the collection and the examples fall into three groups. The first is the static but structurally elaborate set, where the work is in the composition rather than the motion: the bank failure bubble chart, the two infographic bar and column charts built with data driven SVG paths, the gauge chart, the unit charts, the waffle charts, the top N donut chart, the variance chart, the voronoi scatter plot, the S&P beeswarm chart, the parliament chart and the president age range chart. The second is the animated set, where a specification drives a sequence over time: the bubble text animation, the fireworks simulation, the Covid map and the particle simulation background, each linked with a note to click to start. The third is the interactive set, where the chart responds to the reader: the force directed graph supports pan, zoom, node drag, dynamic labels, network highlighting and arrows showing the transfer direction, the gantt chart supports pan and zoom as well as day, month and year periods, and the parallel coordinates chart is described as interactive. The Sankey chart sits in the same family. Three tiers in one collection is a good way to learn, because the static examples teach the grammar, the animated ones teach the timing model, and the interactive ones teach the interaction model.
The data behind the examples, and where the boundaries are
The data sources are named throughout, and they are a useful guide to what the specifications expect. Bank failures come from the FDIC and are plotted against those from 2008, with one online editor link for the absolute figures and another for the inflation adjusted version, which is a nice piece of honesty about how a chart can mislead. The Covid map uses data from the UK coronavirus data site. The Mekko chart uses SIPRI military expenditure data. The organisation tree chart takes its images from Pexels and Unsplash, and the base64 image processing code was borrowed from Chris Webb. The calendar heatmap is a multi-year template built in Vega-Lite. Two of the examples are explicitly templates rather than finished visualisations, the Mario bubble art and the Gantt chart both carry instructions for creating your own. The Gantt entry is also the clearest statement of the limits of the free material, since the README says that if you need task baselines, more levels in the task hierarchy or hourly granularity, you should get in touch for consultancy.
A portfolio, a consultancy funnel, and a licensing question
The repository is not only a gallery. There is a portfolio image at the root, a demo reel linked as a short video, and a paragraph inviting readers who want help customising the charts to reach the author on LinkedIn for paid consultancy services, repeated in the Gantt entry with a more specific list of the advanced features that would require it. So the project has a dual purpose: it demonstrates what the author can do, and it is the top of a funnel. That framing is worth understanding before you adopt it, because it tells you what to expect from maintenance. The repository is MIT licensed with a LICENSE file, which covers the specifications themselves. The inspirations it credits, Mike Bostock, Daniel Shiffman, the Flerlage Twins and Chris Webb's code, carry their own terms, and the images come from Pexels and Unsplash, so a commercial project that reuses a chart wholesale inherits more than the MIT grant. The last push to the repository was on 2026-09-25 and there are no GitHub releases, so the history is a set of commits and the folder listing, which is how a collection like this is meant to be browsed anyway.
Editorial conclusion
Adopt this gallery if you build Power BI reports and have hit the ceiling of the built-in visuals, because each example is a working Vega specification you can open, read and adapt rather than a screenshot of an idea. Do not adopt it as a component library, because there is no package to install and no code to call, it is a gallery of specifications and a record of what is achievable. Before you use one in production, open its online editor and check the data assumptions, since some examples rely on techniques that only work in Deneb's certified environment, and note that the repository's own license covers the specifications while the credited inspirations and the third party image sources carry their own terms.
Frequently asked questions
What is this collection of charts?
It is a collection of advanced data visualisation examples using Vega, Vega-Lite, Deneb and Power BI. The README states that all the work is original and that where it was inspired by others, that has been pointed out.
How do I open and adapt an example?
Each example has its own directory with a thumbnail and a link to an online editor where the specification can be opened and modified. Some entries, such as the Gantt chart and the Mario bubble art, also include instructions for creating your own version.
Why is embedding topojson inline needed for the Covid map?
The README explains that topojson can be tricky to get working in the certified Deneb visual because no loading from external sources is allowed, and that the accompanying .pbix shows the approach of embedding the topojson inline.
Which charting techniques does the collection cover?
Among them a convex hull implemented with the Graham Scan algorithm using only transforms and signals, an arc chart, a Mekko and Marimekko bar chart, an organisation tree with expandable nodes and profile photos, a force directed graph with pan, zoom and drag, a gantt chart with pan and zoom, a Sankey diagram, unit charts, waffle charts and a beeswarm chart, spread across static, animated and interactive examples.
What licence does the Deneb Showcase use?
It is MIT licensed, with the LICENSE file at the root. The credited inspirations and the third party image sources used by some examples carry their own terms separately. The last push to the repository was on 2026-09-25 and there are no GitHub releases.
Official sources
Add this badge to your README
If you maintain this project, the badge below links readers to this analysis and shows its maintenance status from the daily GitHub snapshot. Paste the markdown into your README; add ?metric=license or ?metric=stars to the image URL for a different field.

[](https://hysenlabs.com/projects/pbi-david-deneb-showcase)Star history chart for your README
[](https://hysenlabs.com/projects/pbi-david-deneb-showcase)Was this useful?