Pino emits one JSON line per call and pushes the work into transports
🌲 super fast, all natural json logger
At a glance
- What is it?
- Pino writes one line of JSON per log call and pushes reformatting into transports on a worker thread. The core fits services feeding a log collector, and leaves readable terminal output to a separate package.
- Who is it for?
- Adopt pino if your service emits structured logs to a collector and you can accept JSON lines locally plus one companion package for readable output. Skip it if you want a single dependency that is legible in a terminal, and read the Long Term Support Policy at docs/lts.md before moving from another major.
- Can I use it commercially?
- Yes. MIT is a permissive licence: you can use, modify and sell software built on it, as long as you keep its copyright and licence notices.
- Is it still maintained?
- Yes. The repository received new commits within the last day.
- What is it written in?
- Mainly JavaScript, according to GitHub's language statistics.
Answers come from the project's GitHub data, last synced on November 14, 2026, and from our analysis. They are not legal advice.
Star history
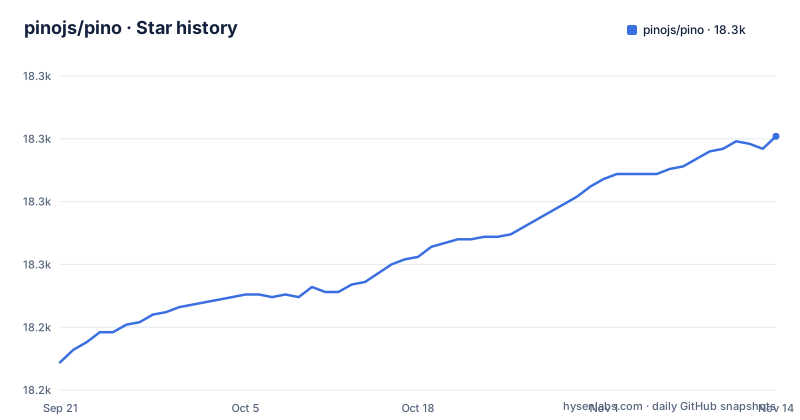
- pinojs/pino18,301 ★ · +90
| Repository | 2026-09-21 | 2026-11-14 |
|---|---|---|
| pinojs/pino | 18.2k | 18.3k |
90 Stars in the last 54 days, measured from the daily GitHub snapshot. Compare with other projects
Editorial analysis
One line of JSON per call, and the five fields pino writes
Every call to a pino logger emits one line of JSON and nothing else. The sample output in the README shows the shape you get with no configuration at all:
{"level":30,"time":1531171074631,"msg":"hello world","pid":657,"hostname":"Davids-MBP-3.fritz.box"}
{"level":30,"time":1531171082399,"msg":"hello child!","pid":657,"hostname":"Davids-MBP-3.fritz.box","a":"property"}
Those keys are the whole contract. `level` is a number, so a collector filters on it without parsing prose. `time` is epoch milliseconds, which means a human reader has to decode it before the line means anything. `pid` and `hostname` are added by pino itself on every line, and the hostname in the sample is a real machine name on someone's home network. Nothing in the README shows a switch that removes those two fields, and the API document it links at docs/api.md is where such a switch would have to be described. If your pipeline treats each line as a record, this is the format you wanted. If a person is going to read it in a terminal, it is not.
npm install pino, then require the module and call it
The project gives two install commands and no configuration step:
$ npm install pino$ yarn add pinoThere is no config file to write and no logger name to pass. A logger is the return value of the module, which is why the sample's first line is `require('pino')()` with the parentheses: what comes back is the object that receives `.info` and `.child` on the following lines.
const logger = require('pino')()

logger.info('hello world')

const child = logger.child({ a: 'property' })
child.info('hello child!')
The package publishes itself as `type: commonjs` with `main` set to pino.js and `types` set to pino.d.ts, so a TypeScript project reads the declarations from the same install rather than from a separate types package. For an older major there is no migration path in the README, only a redirect: to install pino v6 you are told to refer to the v6.x branch of the repository. Beyond that, the README links a Long Term Support Policy at docs/lts.md.
logger.child merges bindings into every line it writes
A child logger is a logger with extra key-value pairs welded to its output. In the sample, the child is built with logger.child({ a: 'property' }) and its line ends with "a":"property" after `msg`, `pid` and `hostname`. The bindings are appended, nothing above them moves, so a line from a child still parses with the same field positions as a line from its parent. That is what makes a request id practical: attach it once to a child, and every call on that child carries it with no per-call argument.
The cost is visible in the repository's own benchmark targets. Under benchmarks/utils/runbench there are separate suites for child, child-child and child-creation, alongside basic, object, deep-object, multi-arg, long-string and formatters, and the default bench script runs the lot:
node benchmarks/utils/runbench allRun that on the hardware that will run your service before deciding how many levels of children a request path creates. Child loggers do not thin output either. A service that makes a child per request and logs at info writes the same number of lines as one without children, except that every line now carries the bound fields. Put a user identifier in those bindings and you have put it in the sink on every single record.
Transports exist because Node runs a single event loop
The design reason is stated once and it is worth reading closely, because it explains the rest of the layout. Because of Node's single-threaded event loop, the README calls it highly recommended that sending, alert triggering, reformatting and all forms of log processing happen in a separate process or thread. The symptom it names is throttling, described as reduced requests per second, caused by log messages accumulating over time.
Pino's answer is a worker thread. Every log processor is called a transport, and the recommendation is to run transports through the pino.transport API, with the detail in docs/transports.md. The repository ships a worked example at examples/transport.js next to examples/basic.js for the no-transport case, and the document list carries separate pages for asynchronous logging at docs/asynchronous.md and for diagnostics at docs/diagnostics.md.
What you get is that the code deciding what a line looks like after it is written lives in another execution context, so a slow destination cannot sit on the request path. What you take on is a second context to reason about. When a transport misbehaves, the failure surfaces in the thread rather than in the call site, and the README does not document what happens to lines already handed over if that thread dies.
browser.js and pino-bare cover runtimes pino does not target directly
Three fields in package.json decide what a bundler or resolver hands you: `main` is pino.js, `browser` is ./browser.js, and `types` is pino.d.ts. The browser field is what a client build resolves, so the Node entry point is not what ships to a browser bundle. A separate Browser API document at docs/browser.md covers that path, and the browser tests are driven by the browser-test script, which serves locally on port 8080:
airtap --local 8080 test/browser*test.jsRuntimes that are not Node are handled by accommodation rather than natively. Pino works on Bare, and on Pear, which is built on Bare, but only through the pino-bare compatibility module. That is a narrower promise than the Node one. You add another package and inherit its behaviour as the bridge, and the compatibility surface is maintained in its own repository rather than here.
Bundling on Node has a documented path as well, since pino supports being bundled with tools like webpack or esbuild, with the details in docs/bundling.md. That page matters more than it looks, because a bundler that honours the browser field or rewrites requires can hand your server code a different module graph than Node would.
Readable output means installing a second package
The core has no answer for a person reading a terminal. The Development Formatting section points at the pino-pretty module for formatting logs during development, and the document list includes a Pretty Printing page at docs/pretty.md. So the readable path is a separate package in its own repository, layered on top of a logger that only emits JSON lines.
That is a genuine cost for a team starting out: two dependencies to install, pin and upgrade, and a second component that can fail between your code and your screen. The other half of it is a genuine fit. A container with no transport configured gets JSON lines on stdout, which is what a collector wants and what a developer does not want to read, and pino-pretty is the documented way to change that for local work. If your requirement is structured output for a collector plus readable output for a person, pino covers the first natively and the second by reference.
Companion packages are grouped in docs/ecosystem.md, and the support links sit at docs/help.md. The boundary between core and add-on is part of the repository layout rather than something that drifted, which is worth knowing before you decide a missing feature is a bug.
The five times claim names no rival and no number
The only comparison in the README is one sentence: in many cases Pino is over 5x faster than alternatives, with a link to docs/benchmarks.md. No alternative is named, no figures are given, no hardware is described, and the hedge sits inside the sentence itself. A reader who needs a number for a purchase decision will not find one on this page.
The repository does at least make the measurements reproducible in shape. Each suite is reached by name through the same runner, so a single case looks like this:
node benchmarks/utils/runbench basicThe default bench script passes all instead, and the suite names listed above cover the arguments that matter when you compare loggers: how many arguments a call takes, how deep the bound object is, how long the string is, and what a child costs to create. Running that on your own machine is the only comparison this repository offers, and it measures pino against whatever the harness in benchmarks/ defines rather than against a list the README names.
No minimum Node version appears in the README itself. The project states which runtimes it targets, Node, Bare and Pear, and links a Long Term Support Policy at docs/lts.md, which is the page to check before upgrading on an older runtime.
Version 10.3.1, a last push on 2026-09-25, and an MIT license
The package publishes version 10.4.0. The last three releases are v10.3.0 on 2026-01-23, v10.3.1 on 2026-02-09 and v10.4.0 on 2026-10-02, and the repository's last push is dated 2026-10-06. Releases are irregular, with almost eight months between v10.3.1 and v10.4.0, and the README links a Long Term Support Policy at docs/lts.md rather than a release schedule.
The upgrade surface is small in form. The license is MIT, there is no native build step in the scripts, and the moving parts are install, lint and test. Quality gates are configured rather than assumed: the borp script runs with --check-coverage and --lines 95, --functions 95, --branches 95 and --statements 95, publish runs prepublishOnly, which executes node test/internals/version.test.js, and the type surface is checked by test-types with tsc, tstyche, ts-node and attw. A smoke test exists as a single command:
node ./test/smoke.jsGovernance is open in a way that is unusual for a logging library. The project states that individuals making significant and valuable contributions are given commit access to contribute as they see fit, and describes itself as more like an open wiki than a guarded repository. Matteo Collina, David Mark Clements, James Sumners and Thomas Watson Steen are named as the team, and nearForm and Platformatic are listed as sponsors.
Editorial conclusion
Adopt pino if your service emits structured logs to a collector and you can accept JSON lines locally plus one companion package for readable output. Skip it if you want a single dependency that is legible in a terminal, and read the Long Term Support Policy at docs/lts.md before moving from another major. Check docs/benchmarks.md first, because the README's over 5x claim names no alternative and gives no figures to argue with.
Frequently asked questions
What does pino do?
Pino writes one line of JSON per log call. The sample output in the README shows each line carrying level, time, msg, pid and hostname, and the project pushes reformatting and sending into transports run in a separate thread.
What are the log levels in pino?
The sample output shows a numeric level field, 30, on a call to info. The README does not list the level names or their numbers, and points to its own API reference at docs/api.md instead.
What is the best logger library for Express?
The repository documents Express integration in docs/web.md#express, alongside Fastify, Hapi, Restify, Koa, Nest, Hono and Node core http, but the README does not rank logger libraries for Express. Its one comparison claim, over 5x faster than alternatives in many cases, points to docs/benchmarks.md without naming an alternative.
Official sources
Add this badge to your README
If you maintain this project, the badge below links readers to this analysis and shows its maintenance status from the daily GitHub snapshot. Paste the markdown into your README; add ?metric=license or ?metric=stars to the image URL for a different field.

[](https://hysenlabs.com/projects/pinojs-pino)Star history chart for your README
[](https://hysenlabs.com/projects/pinojs-pino)Was this useful?