plotly/plotly.js: the obvious latest URL has been frozen since version one
Open-source JavaScript charting library behind Plotly and Dash
At a glance
- What is it?
- Plotly.js is one JavaScript library that also powers the Python and R modules of the same name, and it can be loaded four documented ways. Two details in the README cost people time. The package the quickstart tells you to install for Node is not the package this repository is named, and the CDN path whose name suggests it tracks releases has not been updated since the last version one patch.
- Who is it for?
- Use Plotly.js if you want one library that covers statistical, three dimensional, scientific, map and financial charts with a consistent data and layout model, and if you can decide your load path once and pin it. Do not use the CDN path whose name suggests it follows releases, because the README says it stopped updating at the last version one patch and now requires an exact version.
- Can I use it commercially?
- Yes. MIT is a permissive licence: you can use, modify and sell software built on it, as long as you keep its copyright and licence notices.
- Is it still maintained?
- Yes. The repository received new commits within the last day.
- What is it written in?
- Mainly JavaScript, according to GitHub's language statistics.
Answers come from the project's GitHub data, last synced on November 14, 2026, and from our analysis. They are not legal advice.
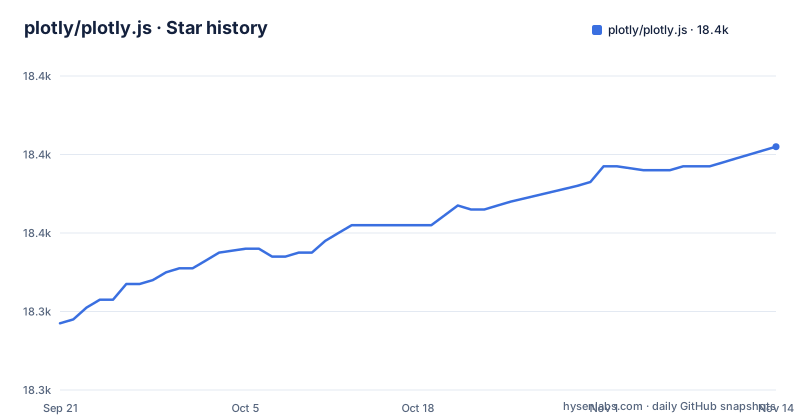
Star history
- plotly/plotly.js18,382 ★ · +45
| Repository | 2026-09-21 | 2026-11-14 |
|---|---|---|
| plotly/plotly.js | 18.3k | 18.4k |
45 Stars in the last 54 days, measured from the daily GitHub snapshot. Compare with other projects
Editorial analysis
The Node install names a different package from this repository
The first section of the README is called load as a node module, and its instruction is to install a ready to use distributed bundle. The command is:
npm i --save plotly.js-dist-minNote the package name. It is not the name of this repository, it is a distribution bundle published alongside it. And the usage examples import and require that name rather than the library's own:
// ES6 module
import Plotly from 'plotly.js-dist-min'

// CommonJS
var Plotly = require('plotly.js-dist-min')
The next sentence offers the alternative: there is also a package without the minified suffix for anyone who prefers an unminified build.
So there are two decisions in the first paragraph of the README rather than one. Which distribution bundle you install, and whether you take the minified or the readable one. Both are documented in a separate file in the distribution directory, which the README points at rather than repeating.
The CDN path called latest stopped updating and will not start again
There is a warning in the README about the CDN, and it is the kind that saves an afternoon.
It says that as of the second major version, the outputs named for the latest build, with a worked example address, will no longer be updated on the CDN and will stay at the last version one patch, which it names. Therefore, to use the CDN with version two and higher, you must specify an exact version.
So the URL that reads most naturally is frozen at a build that predates three major versions of the library, and it fails silently: the script loads, the global appears, and you are charting with a version one build.
The fix is in the same paragraph and the README's own examples already do it. Both the minified and the unminified script tags carry a full version in the path, four point two point zero in the current text. Which means the documented snippet is rewritten on every release, and if you copy it from a cached page of the README you are pinning whatever version that page described.
Four load paths, and the fourth one is a build document
The table of contents has four entries before the documentation section, and they are the four ways in.
The node module, which is a distribution bundle from the registry. The script tag, which puts the object on the window and is documented in two variants, a classic script tag and a native module import inside a script tag. And bundles, which come in two kinds according to the README: complete and partial official bundles distributed to the registry and to the CDN, described in a file in the distribution directory, and custom bundles you build yourself to optimise the size depending on your needs, with a document of its own.
The fourth entry is the escape hatch. If your library needs to bundle or directly load the library's internal entry point, or parts of its modules similar to a basic entry point, in some other way than via an official or a custom bundle, or if you want to tweak the default build configurations, there is a separate build document.
So the choice is bundle size against build control, and the first three paths are supported surfaces while the fourth is the one you read when none of them fits.
Math is a second script from a second CDN, and the renderer is your choice
The README has a section on mathematical typesetting, and its first fact is a limitation: the library supports rendering expressions inside plots using version three or version four of that engine, and the engine is not included in the bundle, so it must be loaded separately as a script on the page.
The two snippets it gives come from a different content delivery network than the library's own. So a page with equations in its charts loads from two providers.
The behaviour once it is loaded is narrow and precise. Any string between dollar signs is rendered, and the list of where that applies is given: plot titles, axis labels, tick label text, and annotations. Nothing else in the figure is affected.
The renderer choice is also yours, with a caveat worth reading. The library uses the scalable vector graphics renderer, and the README says this should not prevent you from using other renderers elsewhere on the same page, and that it does not affect the global configuration. It points at a file in its own development tools directory as a worked example of a page that uses a different renderer for its main content and still displays charts with equations.
Several WebGL charts on one page need a shim, and only for the older context
There is a short section with a question in the heading, and the answer is one extra script.
If you need several WebGL graphs on a page, the instruction is to load a virtual context script before loading other scripts. The parenthetical is the important part: it is for version one of the graphics API and not version two.
So the documented remedy for multiple WebGL charts is a shim for the older context model, loaded first, and the newer context model is not what this addresses.
The mechanism is also a build-layer dependency rather than a chart one. A page that draws several of the library's WebGL graphs needs the virtual-webgl script ahead of other scripts, and the ordering is part of the instruction, which is the kind of detail that only appears in a README that has been maintained through several major versions.
Two generated files are diff-checked, and the build empties the output first
The manifest's script list is mostly a build system, and three entries in it are worth reading.
One regenerates the schema type declarations and then fails if the committed file differs from the regenerated one, using a diff that exits non-zero on any change, and it names both the generated declaration and a test fixture holding the schema as data. A second runs the preprocessing step and fails if a generated worker file differs. A third generates the entry point type declarations and has a check mode for the same purpose.
So generated output is committed and verified, in three places. The failure mode is a stale generated file, and the design catches it in continuous integration rather than in a consumer's type checker.
The build itself begins by emptying the output directory before preprocessing and generating the entry point types. Combined with the fact that the distribution bundle is committed in the tree, the repository is a source tree plus its published artefacts, checked for agreement.
The tree carries a PHP manifest, a retired registry manifest and a shading language fork
The repository root is wider than a JavaScript library's, and the extra files are history rather than mistakes.
There is a PHP package manifest, which is how the library reached a language it is not written in. There is a manifest for a package registry that has been retired, which is how it was distributed before the main registry. There is a Windows continuous integration configuration. There is a stackgl_modules directory holding WebGL-related modules inside the tree.
There is also a directory for map topology data, a staging directory for log output with scripts to empty and to use it, a build configuration for a newer bundler that sits beside a bundler field in the manifest pointing at the distribution bundle, and both a general ignore file and one specific to the registry package.
The practical consequence is that the tree carries both a webpack field in the manifest, pointing at the distribution bundle, and a newer esbuild configuration.
Editorial conclusion
Use Plotly.js if you want one library that covers statistical, three dimensional, scientific, map and financial charts with a consistent data and layout model, and if you can decide your load path once and pin it. Do not use the CDN path whose name suggests it follows releases, because the README says it stopped updating at the last version one patch and now requires an exact version. Check four things before you ship: which package you install for Node, since the quickstart names a distribution bundle rather than the repository's own package, with a minified and an unminified variant; which CDN URL you write into your page, since an exact version and a character set are both load-bearing; whether you need math, since the typesetting engine is not bundled and comes from a different CDN with a renderer choice; and whether you have several WebGL based charts on one page, since the documented fix is a shim for the older graphics context only. The license is MIT, the version is 4.2.0, and the last push was 2026-10-29.
Frequently asked questions
Is Plotly Python or js?
This repository is the JavaScript library, and the README says it also powers the Python and the R modules of the same name in their own ecosystems, referred to as the Python and R versions. So all three are the same library exposed through different language surfaces rather than three separate products.
What is Plotly used for?
For dozens of chart types and visualisations, including statistical charts, three dimensional graphs, scientific charts, SVG and tile maps, and financial charts. A figure is described by a data object and a layout object, and the new plot method draws it into a chosen element in the page.
Is Plotly.js free?
It is released under the MIT licence, published to a package registry and to a free content delivery service. The README does point to commercial consulting, dashboard development, application integration and feature additions, plus a project maintenance page.
Which is better, Plotly.js or Highcharts?
The README makes no comparison and does not name any competing charting library. What it describes is a standalone JavaScript data visualization library that draws an interactive figure from a data object and a layout object, and that can be loaded four documented ways.
plotly js vs d3
No comparison is offered. The README describes this project as a standalone data visualization library covering statistical, three dimensional, scientific, map and financial charts, and it documents a node module install, a script tag, official and custom bundles, and a separate build document for anything else.
Official sources
Add this badge to your README
If you maintain this project, the badge below links readers to this analysis and shows its maintenance status from the daily GitHub snapshot. Paste the markdown into your README; add ?metric=license or ?metric=stars to the image URL for a different field.

[](https://hysenlabs.com/projects/plotly-plotly-js)Star history chart for your README
[](https://hysenlabs.com/projects/plotly-plotly-js)Was this useful?