Reversal 3.5: a call buying study whose research notebook is still two versions behind
Python-based quant trading research project for short-term reversal option setups, universe selection, staged-entry backtesting, and live paper trading.
At a glance
- What is it?
- randomwalkhan/Short-Term-Reversal-Strategy studies buying near the money calls after sharp intraday drawdowns, narrowing from a ten name watchlist to a four symbol universe, and publishing a live paper dashboard into its own README between HTML comment markers. The research notebook is version 3.3 while the official strategy is 3.5, and the exit ladder differs between the two.
- Who is it for?
- This repository is worth reading as a record of how a trading idea gets disciplined, because it keeps the negative results and the rejected refinements next to the accepted ones, the universe comparison is a committed output rather than a claim, and the author is explicit that a narrower universe beat a broader one, which is the opposite of the usual instinct.
- Can I use it commercially?
- Check first. The repository uses a licence we do not classify automatically, so read its LICENSE file before any commercial use.
- Is it still maintained?
- Yes. The repository last received commits 18 days ago.
- What is it written in?
- Mainly Jupyter Notebook, according to GitHub's language statistics.
Answers come from the project's GitHub data, last synced on October 4, 2026, and from our analysis. They are not legal advice.
Star history
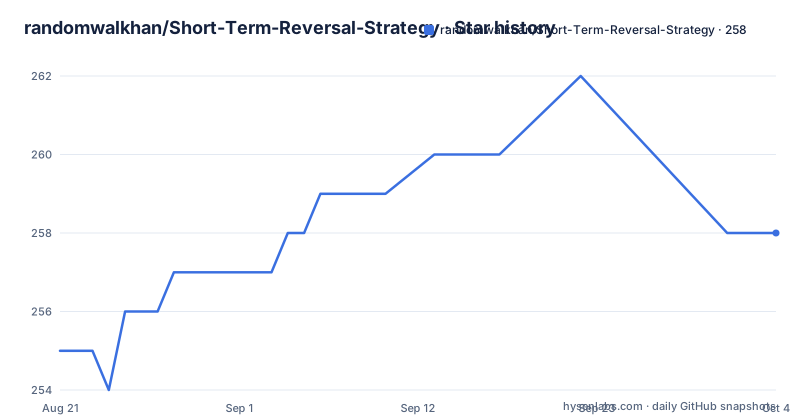
- randomwalkhan/Short-Term-Reversal-Strategy258 ★ · +3
| Repository | 2026-08-21 | 2026-10-04 |
|---|---|---|
| randomwalkhan/Short-Term-Reversal-Strategy | 255 | 258 |
3 Stars in the last 44 days, measured from the daily GitHub snapshot. Compare with other projects
Editorial analysis
The README is a live dashboard written between comment markers
The front page of this repository is not documentation, it is generated output. A block near the top is fenced between two HTML comment markers with a version name in each, and everything between them is overwritten by the live paper runner. What lands there is a checkpoint timestamp in eastern time, an equity figure, a realized and unrealized split, a count of open positions, a count of trades closed today, the name of the current scan slot, the active universe, and links to a dashboard and to two CSV files of live trades and live equity. The same mechanism appears in the table of research outputs further down, where each row links to a result CSV and a chart image. The practical consequence is that the README tells you when the numbers were produced, which is unusual and useful, and that the version markers are the only thing pinning the prose to a script. If a runner stops, the block freezes at its last checkpoint and the readme keeps claiming a state that is no longer true. The one open position at that checkpoint is worth reading as a snapshot rather than a result, and it is laid out in full:
ticker asset_type execution_mode          instrument  units  cash_spent  current_position_value  current_price  unrealized_pnl  unrealized_return_pct  business_days_held
META option option META261120C00735000 8 38740.0 36360.0 45.45 -2380.0 -6.14 1The official strategy is 3.5, the research notebook is still 3.3
Two version numbers run in parallel here and the readme states the relationship in one sentence, twice, once in English and once in Chinese. The notebook is described as remaining the current research notebook for the short term reversal analysis and for estimating option profitability confidence, while 3.5 is named as the current execution and filtering version. So the ideas being tested and the code that would place a trade are deliberately decoupled: new filters land in the execution layer while the notebook keeps the analysis that justified the original signal. The repository filename convention makes the history legible, since nearly every script carries a version in its name, running from a two point two point one variant through two point five, then three point one, three point three and a four point one paper script, alongside separate experiment scripts for the minimum drop threshold, leveraged ETF overlay, target and exit ladder, and timing overlay. The cost of that discipline is that a reader looking for the current strategy has to know which of those files feed the live runner.
The exit ladder is ten percent in research and fifteen in live
The trade framing section is a single line with four numbers in it, and one pair of them disagrees. The setup buys near the money calls, with a time to expiration of roughly thirty days in the backtests. The exit ladder in research is a plus ten, plus fifteen, minus ten ladder, meaning a first target at ten percent, a second at fifteen, and a stop at minus ten. The ladder in live execution is plus fifteen, plus fifteen, minus ten. So the first target is five percentage points higher live than in research, and the middle rung is duplicated. The readme does not explain the change, and it is exactly the kind of quiet divergence that matters, because any performance number in the repository could be describing the research ladder while the live dashboard is running a different one. A reader comparing a backtest result to a live trade log is comparing two strategies with the same name unless they check this line.
Four symbols at the top, and a script that showed narrower beat broader
The official universe is defined by an expression that adds a filtered list to three named tickers: a semiconductor exchange traded fund, its triple leveraged counterpart, and a memory themed fund. The three additions sit on top of a filtered base whose construction is itself a filter rather than an index, carrying a sixty day lookback, a requirement for at least ten matched signals, a minimum current drop of half a percent, and a valuation guard that excludes anything trading above a trailing price to earnings of 140 unless it is an exchange traded fund. That last clause is doing a lot of work: it means the leverage and memory additions are exempt from the valuation ceiling, so the guard applies to individual companies and not to the funds bolted on top. The most interesting result in the repository is the comparison script that tested universes directly and found the effect strongest in the narrower filtered base rather than the broader pool, which is the opposite of the usual diversification instinct and the reason the base is filtered rather than the additions replaced.
A timing gate that decides not to trade, added after reading about window lengths
The fifth research step is described with unusual honesty about why it exists. After reading research on how technical indicator window length has to match the prediction horizon, the author tested a shorter window timing overlay. The stated goal was explicitly not to overturn the main strategy: once the base signal is valid, the overlay decides whether this particular trade should be taken. What shipped is a five day technical indicator timing score with a no-trade gate at 0.50, so a score below half means no position. This is the most consequential mechanism in the repository and the easiest to misread. A gate that blocks trades improves a track record by definition when the underlying signal is mediocre, so the right question is not whether the gated version looks better but how many signals it removed and what the ungated version did on exactly those. The readme also carries a separate live trend health gate that blocks short term down channels, so a live trade must clear two regime conditions before the timing score is even consulted.
Overfitting gets its own script, and the guardrails get their own file
The repository treats its own reliability as an open problem, and two entries in the top level show it. One script analyses overfitting in an earlier version's results directly, and another analyses whether a regime score has genuine predictive power rather than being a number that happened to look good in sample. Neither is a diagnostic you would find in a trading script, and their presence is the most credible signal in the tree. Alongside them is a research guardrails document referenced by name in the strategy summary as the project's research discipline, which is a written statement of the rules the author holds themselves to, separate from the code that enforces the trading filters. The results directory, the assets directory with its chart images, and a versions directory holding the preserved early notebooks complete the picture: this is a repository that keeps its history, including the versions that were superseded, rather than replacing them.
One live position, nearly half the account, held for a day
The open position table in the readme is worth reading as a snapshot of the paper account rather than as a result. The single open position is a call on a chipmaker, eight contracts, with cash spent of 38,740 against a current position value of 36,360 at a price of 45.45, an unrealized loss of 2,380, a return of minus 6.14 percent, and a business days held of one. Against the stated equity of 82,858, that position is roughly 47 percent of the account in a single name, and it is the only one, with zero trades closed that day. The contract identifier follows the standard option naming pattern, carrying the ticker, the expiration month, day and year, a call marker and a strike, so the holding has a defined expiry a few weeks out from the checkpoint date. None of this is a criticism of a paper test, which is what it is, but it is the clearest illustration of what the documentation does not contain: there is no position sizing rule, no maximum concurrent positions, and no capital constraint stated anywhere in the readme.
The path from ten tickers and three inputs to a live paper runner
The research journey section reconstructs the whole arc, and it is the reason to read this repository at all. The first version pulled one year of daily close, high and low prices from a public finance site for a watchlist of about ten names, computed a daily maximum drop, and took three manual inputs: a same day drop threshold, a recovery target, and a lookahead window. It then reported which tickers recovered a given fraction of the drop within that window. The second step added options, taking expiry, implied volatility, entry price and a risk free rate as inputs and using a closed form pricing model plus a geometric random walk simulation to estimate day by day profit intervals for a call, which moved the question from which names bounce to what the trade would look like. Everything after that is incremental and versioned: formalising the signal day, testing universes, tightening the window, adding regime filters, holiday handling, an option liquidity gate with a no-trade rule when liquidity is poor, scheduled scans with no lookahead, and results written back to a published dashboard.
Editorial conclusion
This repository is worth reading as a record of how a trading idea gets disciplined, because it keeps the negative results and the rejected refinements next to the accepted ones, the universe comparison is a committed output rather than a claim, and the author is explicit that a narrower universe beat a broader one, which is the opposite of the usual instinct. It is not a system to trade from, since the live side is a paper test, the position sizing implied by a single eight contract position is a research parameter rather than a risk policy, and nothing in the documentation describes capital constraints. Before drawing any conclusion from it, check three things: whether the numbers you are reading are research or live, because the first exit rung is ten percent in research and fifteen in live execution, so the same strategy name covers two different exit rules; what the regime and timing gates actually removed, since a no-trade gate at a fixed threshold can turn a losing strategy into a quiet one by trading less; and what the universe is on any given day, because the four symbol list is an input file in the repository and adding a symbol is a decision, not a data update.
Frequently asked questions
What is the Reversal strategy in this repository?
It is a call buying setup built around large intraday drawdowns. After a sharp down day it asks whether a given name recovers a set fraction of that drop within a lookahead window, and the current official version is Reversal 3.5, described as a research project rather than a product.
What is in the official universe?
The universe is a filtered base list plus three named exchange traded funds: a semiconductor fund, its triple leveraged counterpart, and a memory themed fund. The base list uses a 60 day lookback, requires at least ten matched signals, a minimum current drop above 0.5 percent, and a trailing price to earnings guard below 140 that applies to non-fund names only.
Does the strategy always trade every valid signal?
No. There is a five day technical indicator timing score with a no-trade gate at 0.50, so a score below half means no position, and a separate live trend health gate blocks short term down channels. The author describes the overlay as deciding whether a valid signal should be taken rather than replacing the main signal.
What are the exit targets in the Reversal backtests?
In research the ladder is plus 10 percent, plus 15 percent, minus 10 percent, and in live execution it is plus 15 percent, plus 15 percent, minus 10 percent, so the first target is five points higher live. Calls are near the money with roughly 30 days to expiration in the backtests.
Is the Reversal repository running live trading?
No, it is a live paper test. The README publishes a checkpoint with equity, realized and unrealized figures, open positions and trades closed today, spliced into the README between HTML comment markers, with a full dashboard and CSV exports linked underneath.
How did the Reversal project start?
With a watchlist of about ten names and one year of daily close, high and low prices from Yahoo Finance, computing a daily maximum drop and taking three manual inputs: a drop threshold, a recovery target, and a lookahead window. An option layer came later, using Black-Scholes and geometric random walk simulations for profit confidence intervals.
Official sources
Add this badge to your README
If you maintain this project, the badge below links readers to this analysis and shows its maintenance status from the daily GitHub snapshot. Paste the markdown into your README; add ?metric=license or ?metric=stars to the image URL for a different field.

[](https://hysenlabs.com/projects/randomwalkhan-short-term-reversal-strategy)Star history chart for your README
[](https://hysenlabs.com/projects/randomwalkhan-short-term-reversal-strategy)